DOCUMENTEDHow the technology works
A sighting becomes a history.
A plate image, the time and a camera’s location can become a searchable record of where a vehicle was. Repeated sightings let someone look back through its movements.
01 · The System
Inside Axon and Flock’s Expanding Surveillance Networks—and the Illegal Searches, Cross-State Access, and Oversight Failures Exposing Their Risks.

A roadside camera captures a moment. Connected surveillance can make it searchable long afterward.
Axon’s ecosystem extends into video evidence management, body-worn and in-vehicle cameras, and connected camera networks. Its Fusus platform brings previously separate sources into a common working environment. Flock’s ecosystem includes license-plate readers, searchable location histories and connected camera networks. Across these ecosystems, investigative search and analytics can turn individual records into information a user can assemble.
These are vendor capabilities, not a verified inventory of VCSO deployments or proof that the two vendors’ networks are connected locally. The Ventura records discussed here document Flock use, later Axon testing and settings changes, and ALPR activity through Fusus Web / ECOM. They do not establish that every advertised camera feed, analytics tool or integration was enabled.
Capability sources and local deployment distinctions: Axon’s Fusus description · Chapter 08: platform capabilities, hardware records and unresolved connections.
A plate image, a time and a camera location can become a searchable vehicle sighting. Repeated sightings can reveal patterns of movement—not necessarily who drove, why they traveled or a complete account of their day.
Retention settings determine how long records remain available in a system. Search permissions and cross-agency sharing determine who can reach them. Downloads, evidence files, software-created information and backups may have separate retention and deletion rules. Deleting the original picture does not necessarily delete every copy or everything learned from it.
The questions are direct: Who can search? Across which cameras, agencies and periods? For what authorized reason? Who verifies that the rules were followed?
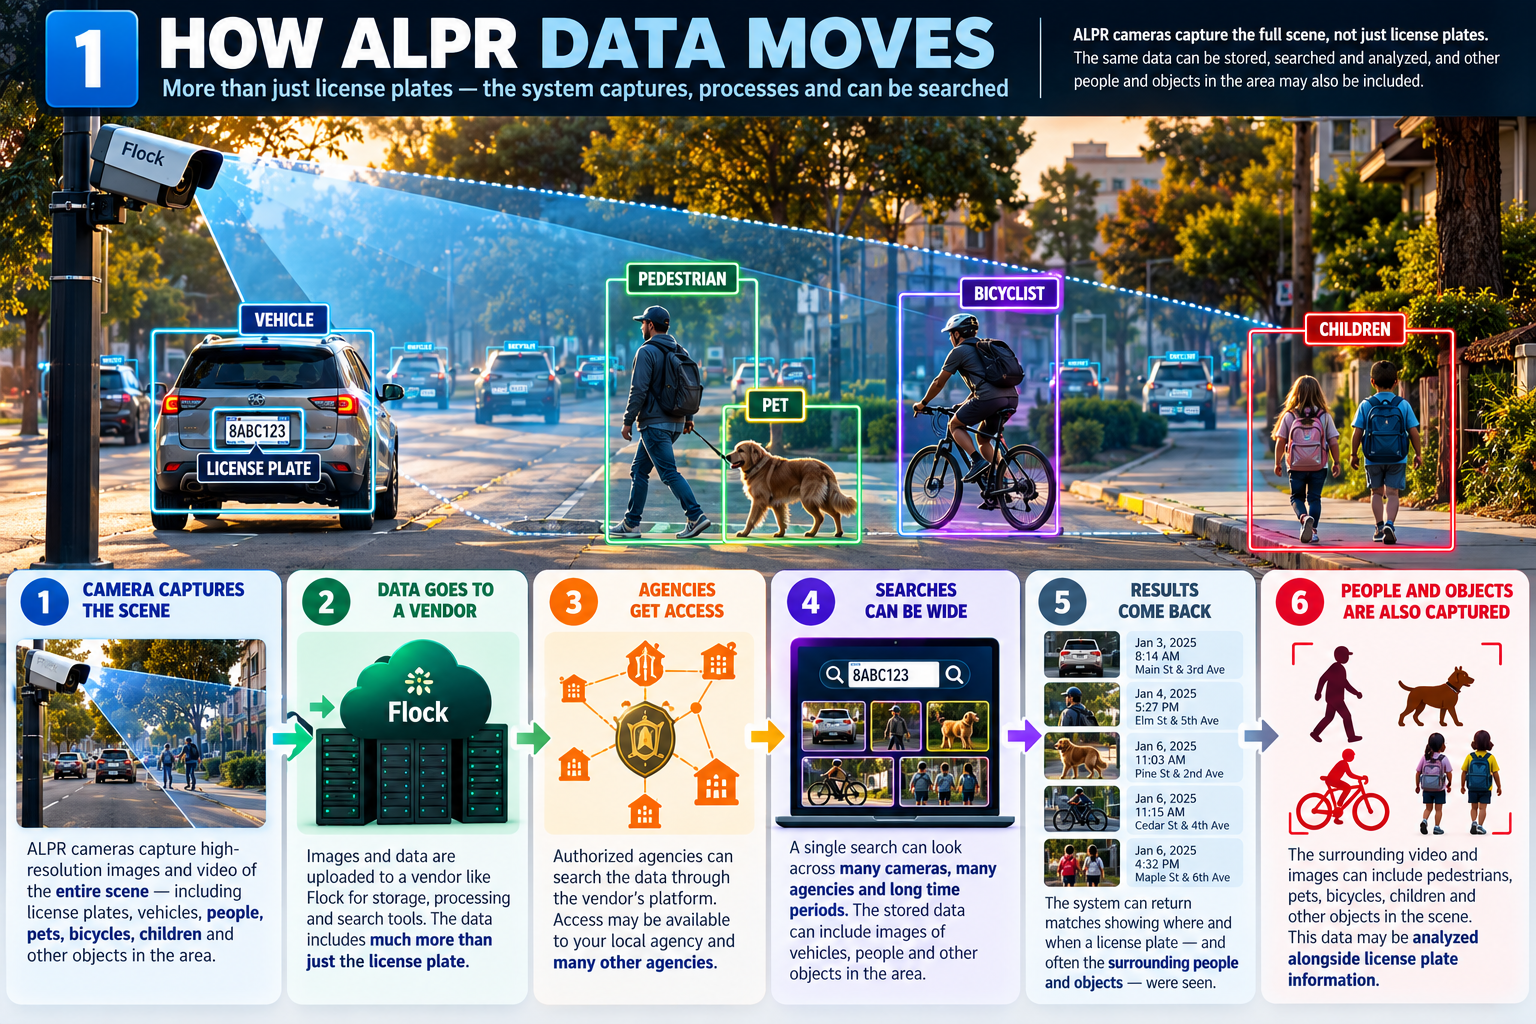
A camera captures a plate. Follow where that information can go—and who can search it.
This is a conceptual illustration, not a verified feature inventory for a particular ALPR device or a map of VCSO’s deployed system. People or objects visible in an image are not necessarily identified, indexed or separately searchable. VCSO-specific records are needed to establish video capture, enabled tools and actual search results.
Indianapolis officers were charged following allegations of personal ALPR tracking. In Braselton, Georgia, a police chief was charged after an investigation of alleged ALPR harassment and stalking. Surveillance access meant for public safety can become a way to intrude on someone’s private life.
Pending charges are allegations, not convictions; the supplied sources do not establish adjudicated guilt in these cases. Audits can—and did—help expose potential misuse: IMPD says its internal audits triggered investigations. The Georgia case involved an external GBI investigation. Neither case establishes misconduct by VCSO, and the Georgia announcement does not identify the ALPR vendor.
Indianapolis case and qualifications · Georgia case and qualifications. Detailed accounts remain in Chapter 09. Sources: WTHR — affidavit reporting, charges and prosecutor’s statement · IMPD — official September 23, 2026 statement (PDF hosted by FOX59) · GBI — official arrest and investigation announcement.
The Ventura audit records examined in this report contain organization entries associated with Texas, Georgia, Illinois and Florida, among other states. Those names raise questions about the reach of California vehicle data.
Audit entries are not necessarily unique searches, matches or successful retrievals. A state association inferred from an organization name does not, by itself, identify the individual user, establish what was returned or prove an illegal search. How was access authorized, how was it governed, and how can those answers be independently verified?
Chapter 03 preserves the state analysis, original graphics and classification limits; the acknowledgment and public assurances are examined separately.
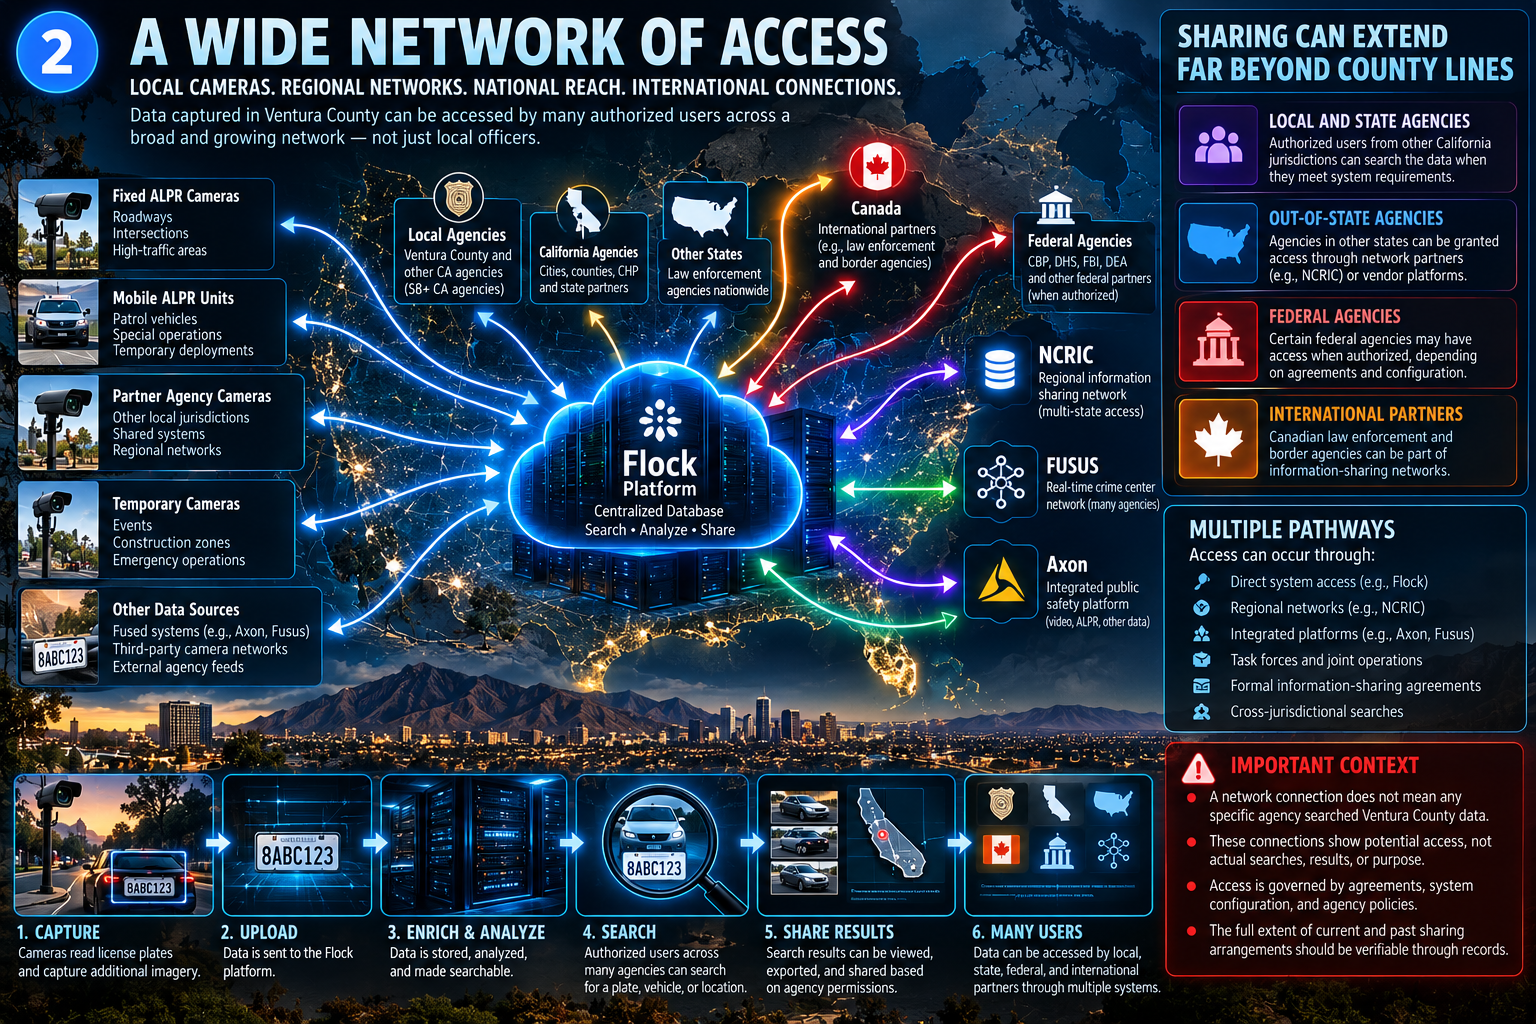
The accountability question extends beyond the cameras and the agency that owns them.
The lines show possible ways to get access, not completed searches, returned information or verified local connections between vendor platforms. Dated agreements and settings records are needed to check federal, out-of-state and international access. The California-agency label represents an attributed assurance, not a verified inventory of all current or historical sharing.
Policies and internal reviews matter. Verification needs a record of who searched, when, what they searched, why they searched, and who reviewed the activity. Review criteria, findings and corrective actions show more than a promise that searches are checked.
Omitted reason fields constrain public verification: an outside reviewer cannot check a search’s purpose from a record that does not supply it. That omission does not prove misconduct or that no internal reason or review exists. Activity logs are not the same as audit findings, and records not supplied are not necessarily records that do not exist.
What was requested · What remains withheld or not provided · The public accountability test.
The chapters that follow trace the changing system and February–March 2025 anomaly, interstate organization entries, public acknowledgments, records requested and received, unresolved oversight questions, the public-interest test, Axon/Fusus integration capabilities, attributed local and national examples, and the actions residents can demand.
The investigation keeps three questions separate: what systems can do; what Ventura County records document about use, settings and deployments; and what the available records prove about access, authorization, results and oversight. A vendor description is not a local deployment record. A recorded action is not, by itself, proof of lawful purpose or every downstream consequence.

DOCUMENTEDHow the technology works
A plate image, the time and a camera’s location can become a searchable record of where a vehicle was. Repeated sightings let someone look back through its movements.
UNRESOLVEDAccountability question
Where do the images go? What vehicle details does the software extract? What conclusions, shared files, evidence files, backups and copies remain elsewhere? The public needs to know how long the system keeps each kind of data—its retention rules.
ANALYSISHow the systems connect
A camera count describes equipment. An account owner describes one relationship. Neither tells residents who can reach the resulting location history, through which systems, or what survives elsewhere.
Source: the investigation’s account of the system and where its data goes, plus the original map of its tools and connections. The missing receipts concern who could use what, settings, sharing, reasons for searches and what happens to the data—not just who owns the cameras.
The Civic Review Packet’s contract summary describes access to local and wider networks, searches by time and location, plate lookup, searching by what a vehicle looks like, and reports of system activity. It explains what the contract offered and how it was funded.
Report-context receipt · project-provided analysis, not the underlying contract or access audit.
DOCUMENTED
VCSO used Flock license-plate readers. The files VCSO provided show a sudden change in reported organization entries during Feb–Mar 2025, with a clear beginning and end. Later Axon records show testing, a recorded change to the retention setting, Fusus/ECOM activity and comparison tests. A recorded setting is not independent verification of how every copy was retained or deleted.
UNRESOLVEDWhat we still don’t know
What fully explains the 2025 change? Who approved changes to the settings? Where did copies of the data go? Which software tools were enabled locally? Where is the complete record of activity across the connected systems?
ANALYSISThe wider regional network
NCRIC, a regional information-sharing center for law enforcement, represents a network of organizations—not one local agency. It appears across 27 months in the original comparison. Knowing which local agency owns a camera is not enough to understand a network this large.
Who participated? Who was allowed to use what? How could one organization reach another’s data? The name printed in a file cannot answer those questions.
NCRIC shows why fewer entries can mean something different from less reach. Comparing January–July 2024 with August 2024–February 2026, the report finds that monthly entries associated with NCRIC fell from 7,421 to 1,181 at the midpoint of each period’s monthly values—the median. Yet the median number of reported networks rose from 214 to 755.
The report also describes an approximately 80% fall in median requested camera-time, measured in device-hours: devices multiplied by the hours in a requested window. The number of entries, networks and requested camera-time moved in different directions. Page 24 asks whether searches were set up differently, practices changed, files missed activity or the system reported it differently.
A license plate may be where the record begins. Understanding who can access that record—and what happens afterward—is where public accountability begins.
Supporting Materials
Check the work for yourself. The report, methods, legal sources, charts and details about the data are here when you want them.
Available materials vs. originals. Included here: charts, data files, the Civic Review Packet and collected legal sources prepared for this review. The packet explains specific findings page by page. The original Flock/Axon audit files, Camarillo presentation and records-request correspondence are not included.
Praeva Analytics ALPR Audit Records Civic Review Packet · 33 pages · September 2026
Read the complete report alongside its charts. This packet contains the analysis prepared for the review, not the agency’s original audit files, response letters or presentation.
Read the report (PDF)Download the reportPage-specific report receipts
Source notes record verification against official California Legislative Information on October 4, 2026:
Project-produced-source cross-checks:
A duty to maintain records or adopt a policy, a duty to disclose records under the California Public Records Act (CPRA), and evidence of actual compliance are three different questions.
Original materials referenced by the investigation but not available here include the redacted Axon audit trail, records-request and deficiency correspondence, and Moorpark City Manager correspondence. Public receipts must protect requester-identifying information.
The original report graphics are all here, with their labels, explanations, sources and full-size views. The image index below also includes the deeper analysis.
ANALYSISMatching organization names to likely states
The examined profile contains 53,277 Texas-associated entries, 26,810 Florida-associated entries, 20,275 Ohio-associated entries and 47,312 Georgia-associated entries. States are assigned from the organization names in the files. The separate organization profile adds frequency, persistence and requested-window context.
The daily evidence identifies an aggregate other-state surge. The state map compares audit-label populations by candidate-associated geography.
Verifying each state’s trend over time requires the underlying name-to-state classifications and dated entries, using the same periods and totals as the report.
The original map remains intact as an analytical receipt. The controlled supplemental profile includes 20,275 Ohio-associated audit observation rows.
Source status and remaining receipts. The totals are transcribed from the report, not independently recalculated from original exports.
Original state map · Organization profile · Original supplemental device-hours analysis (new tab) · Return to Chapter 03
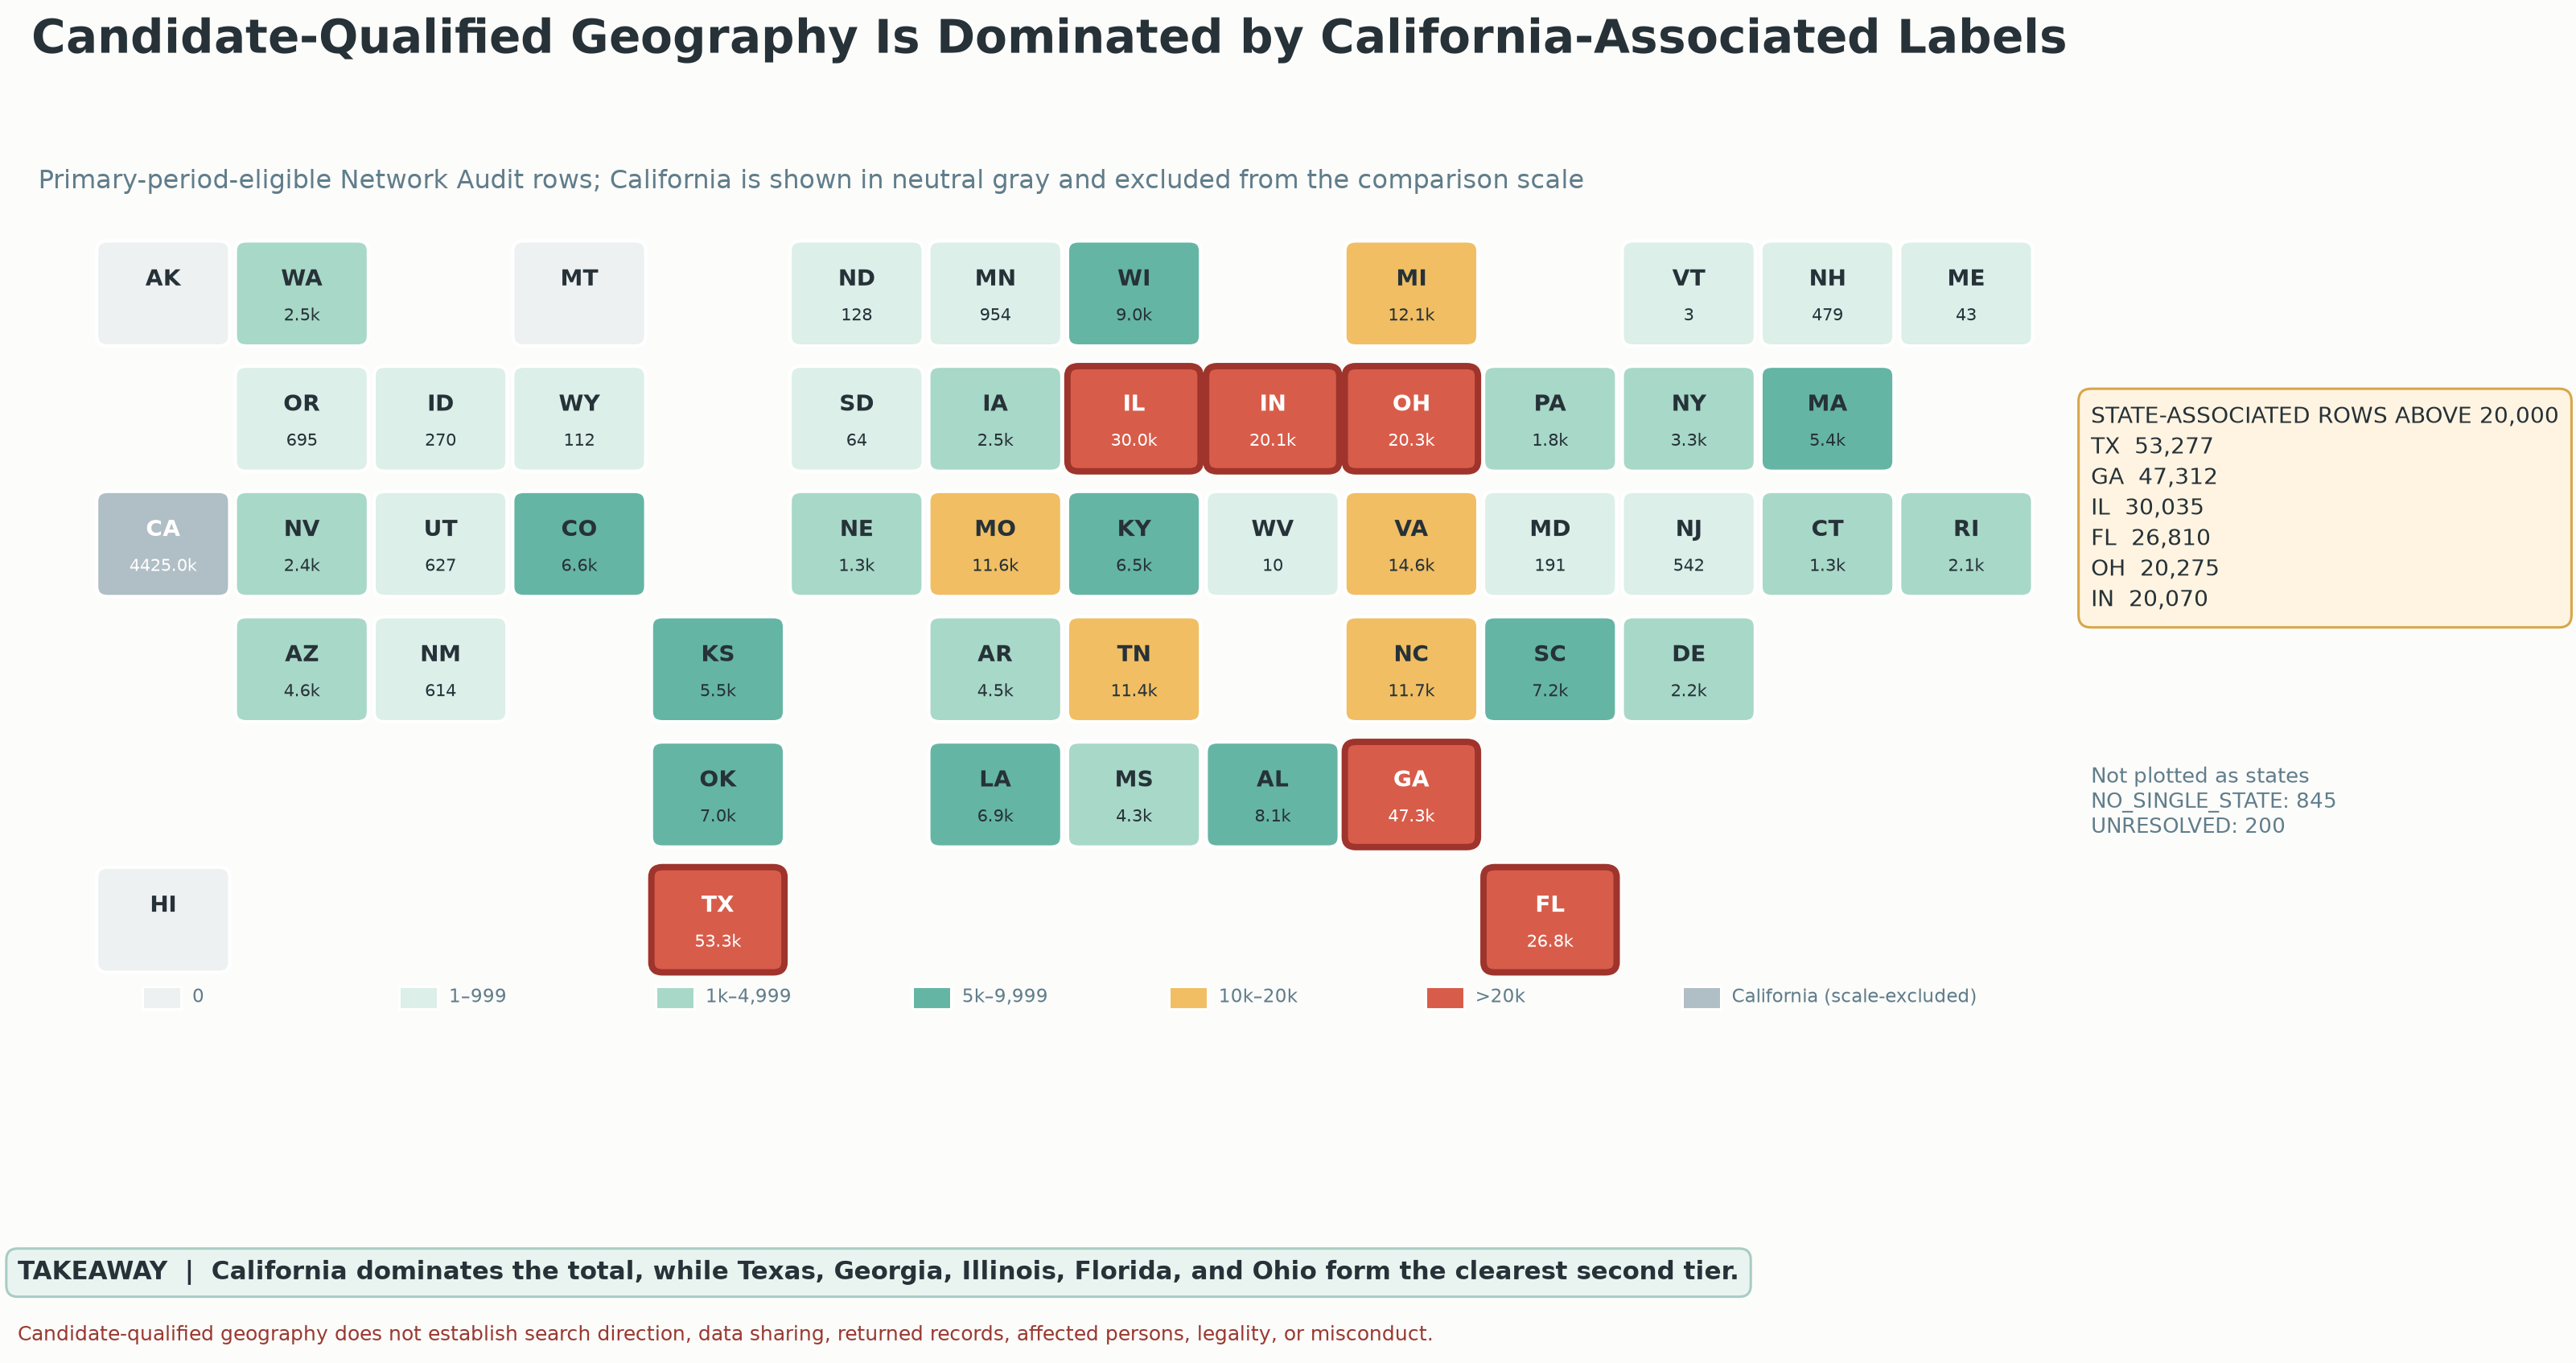
This original map classifies primary-period-eligible Network Audit rows by candidate-associated state. It compares populations rather than trends over time. The February–March surge appears separately in the daily-regime graphic. Unknown or multi-state labels remain separate.
Source: Praeva Analytics candidate-state map; totals are transcribed from the analytical report, not independently recalculated. Original name-to-state classifications and dated state-level tables are not available here.
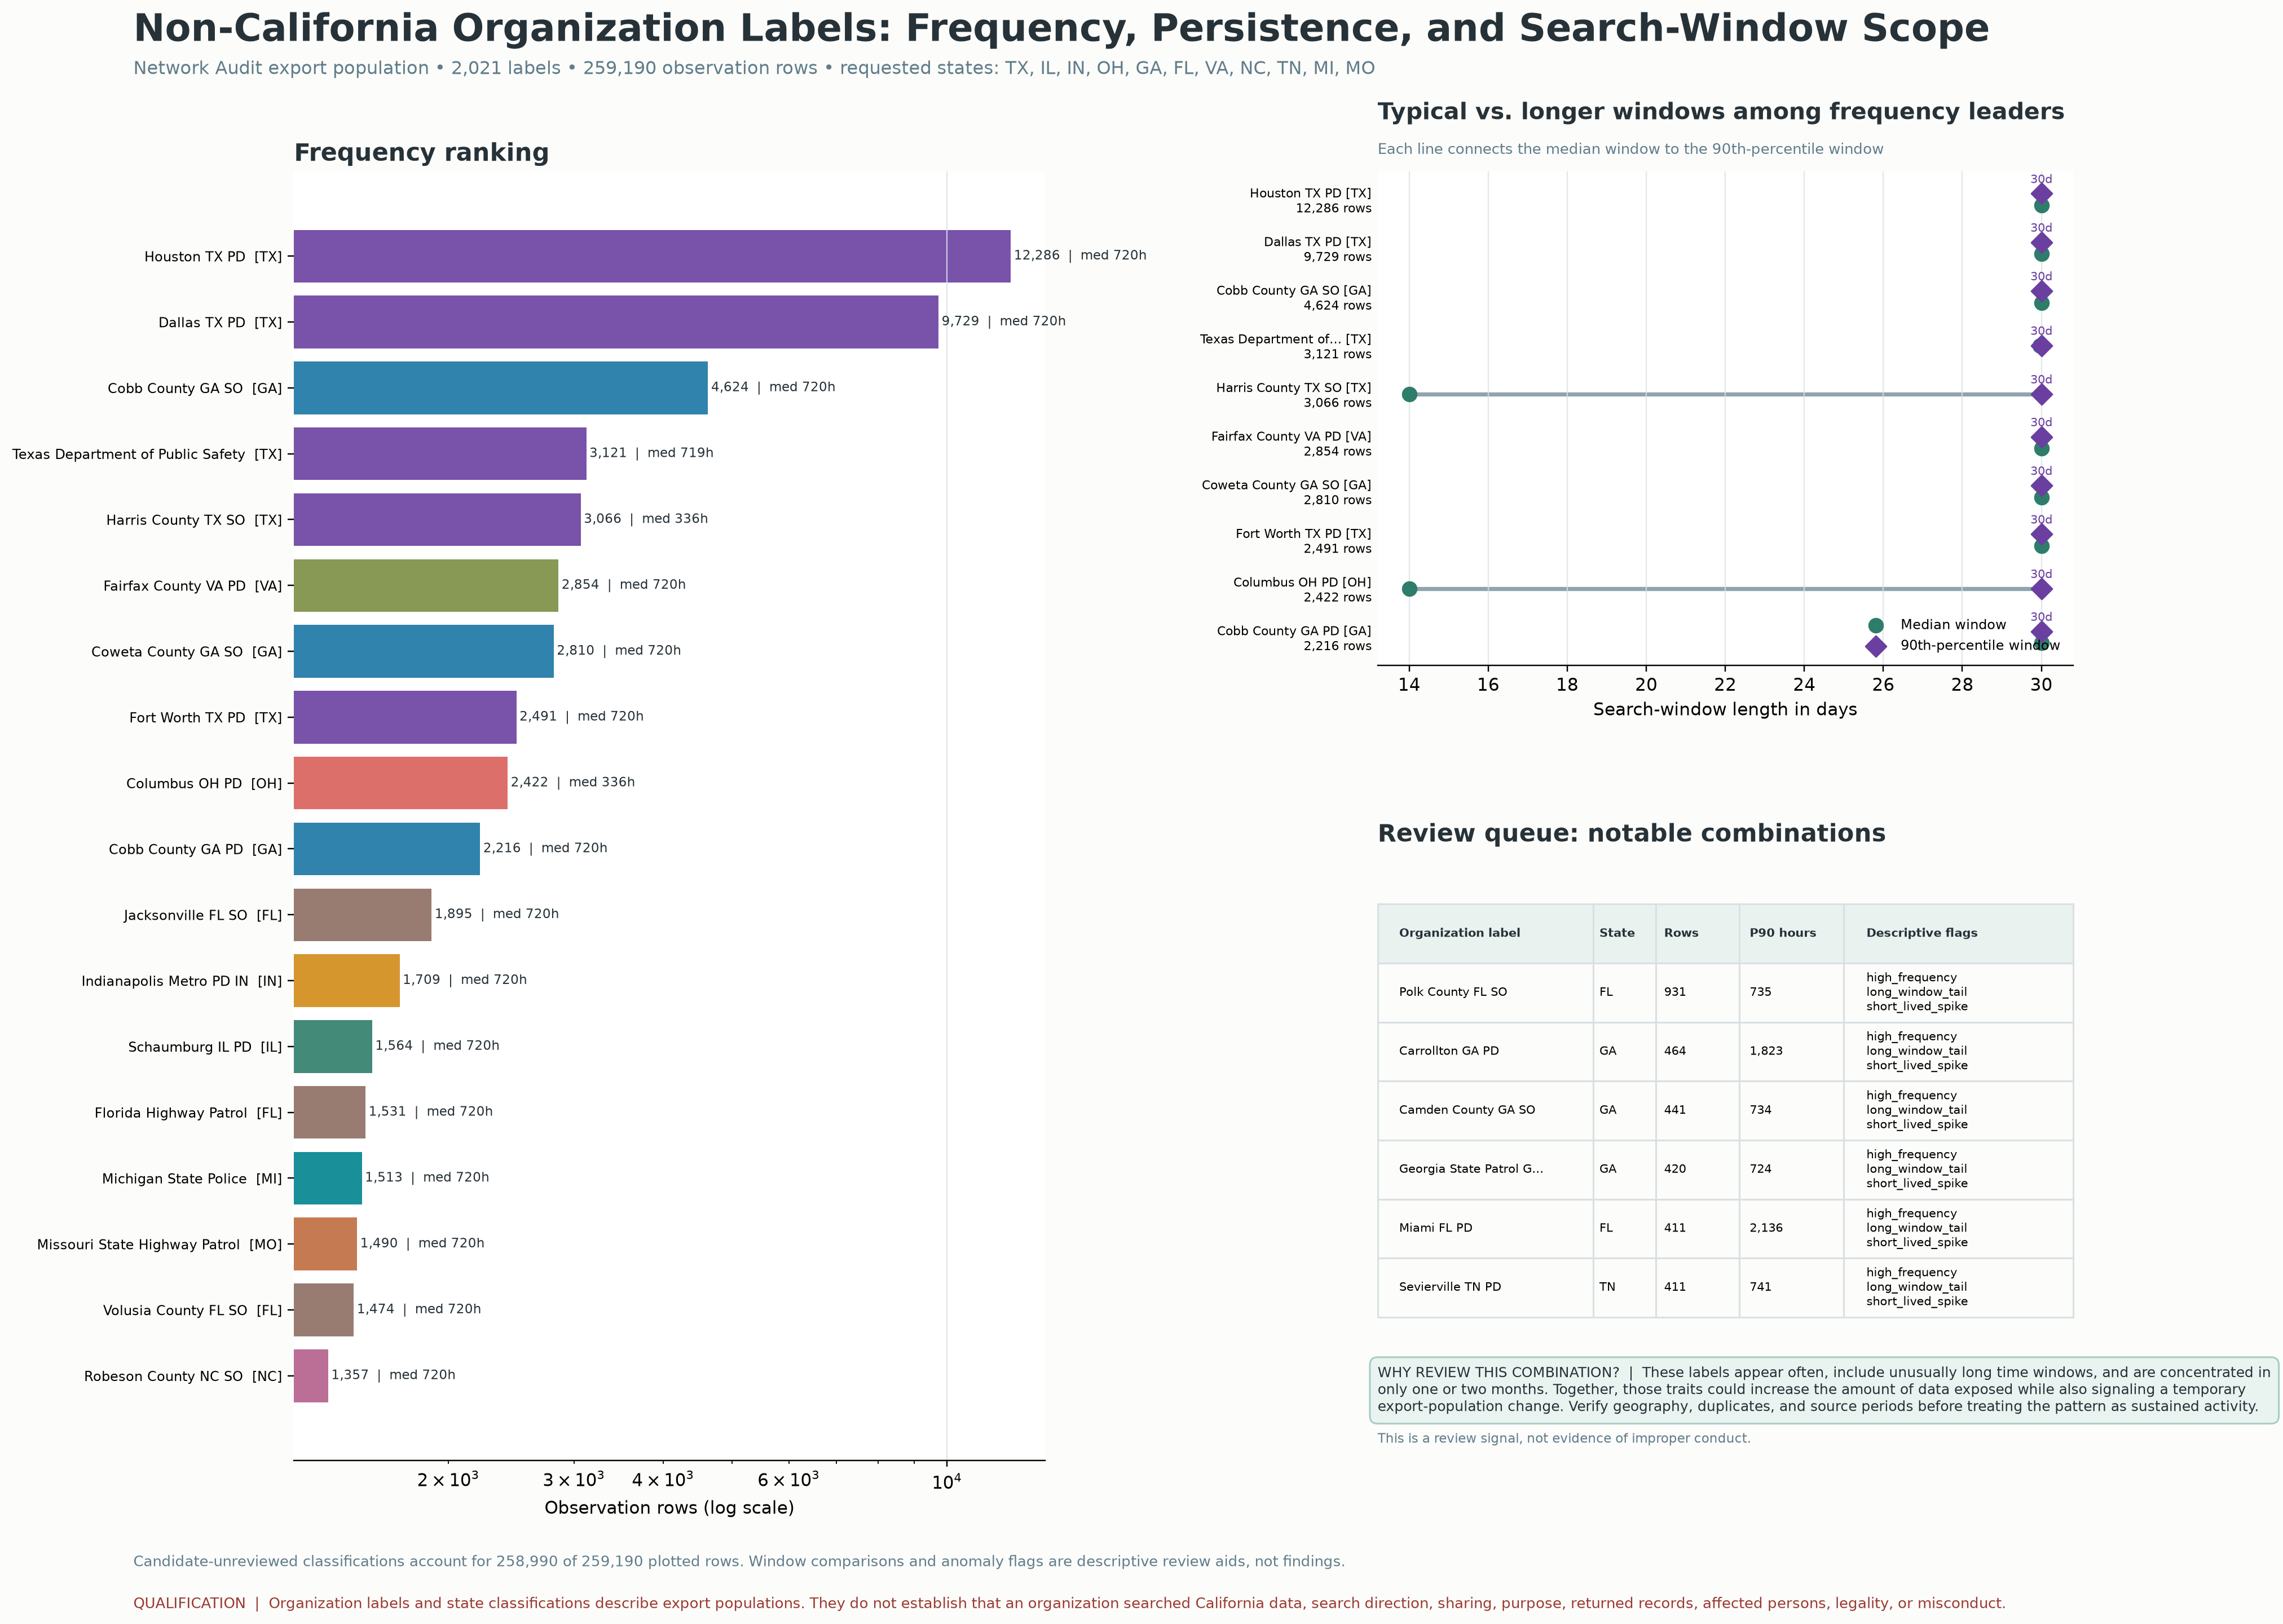
The graphic compares export rows, observed persistence and requested time windows for a selected non-California label population. The controlled supplemental profile includes 20,275 Ohio-associated audit observation rows. Review flags identify labels for further examination.
Source: Praeva Analytics organization profile; Civic Review Packet pp. 6–7 explains the screening approach. Underlying classification and query-level tables are not available here.
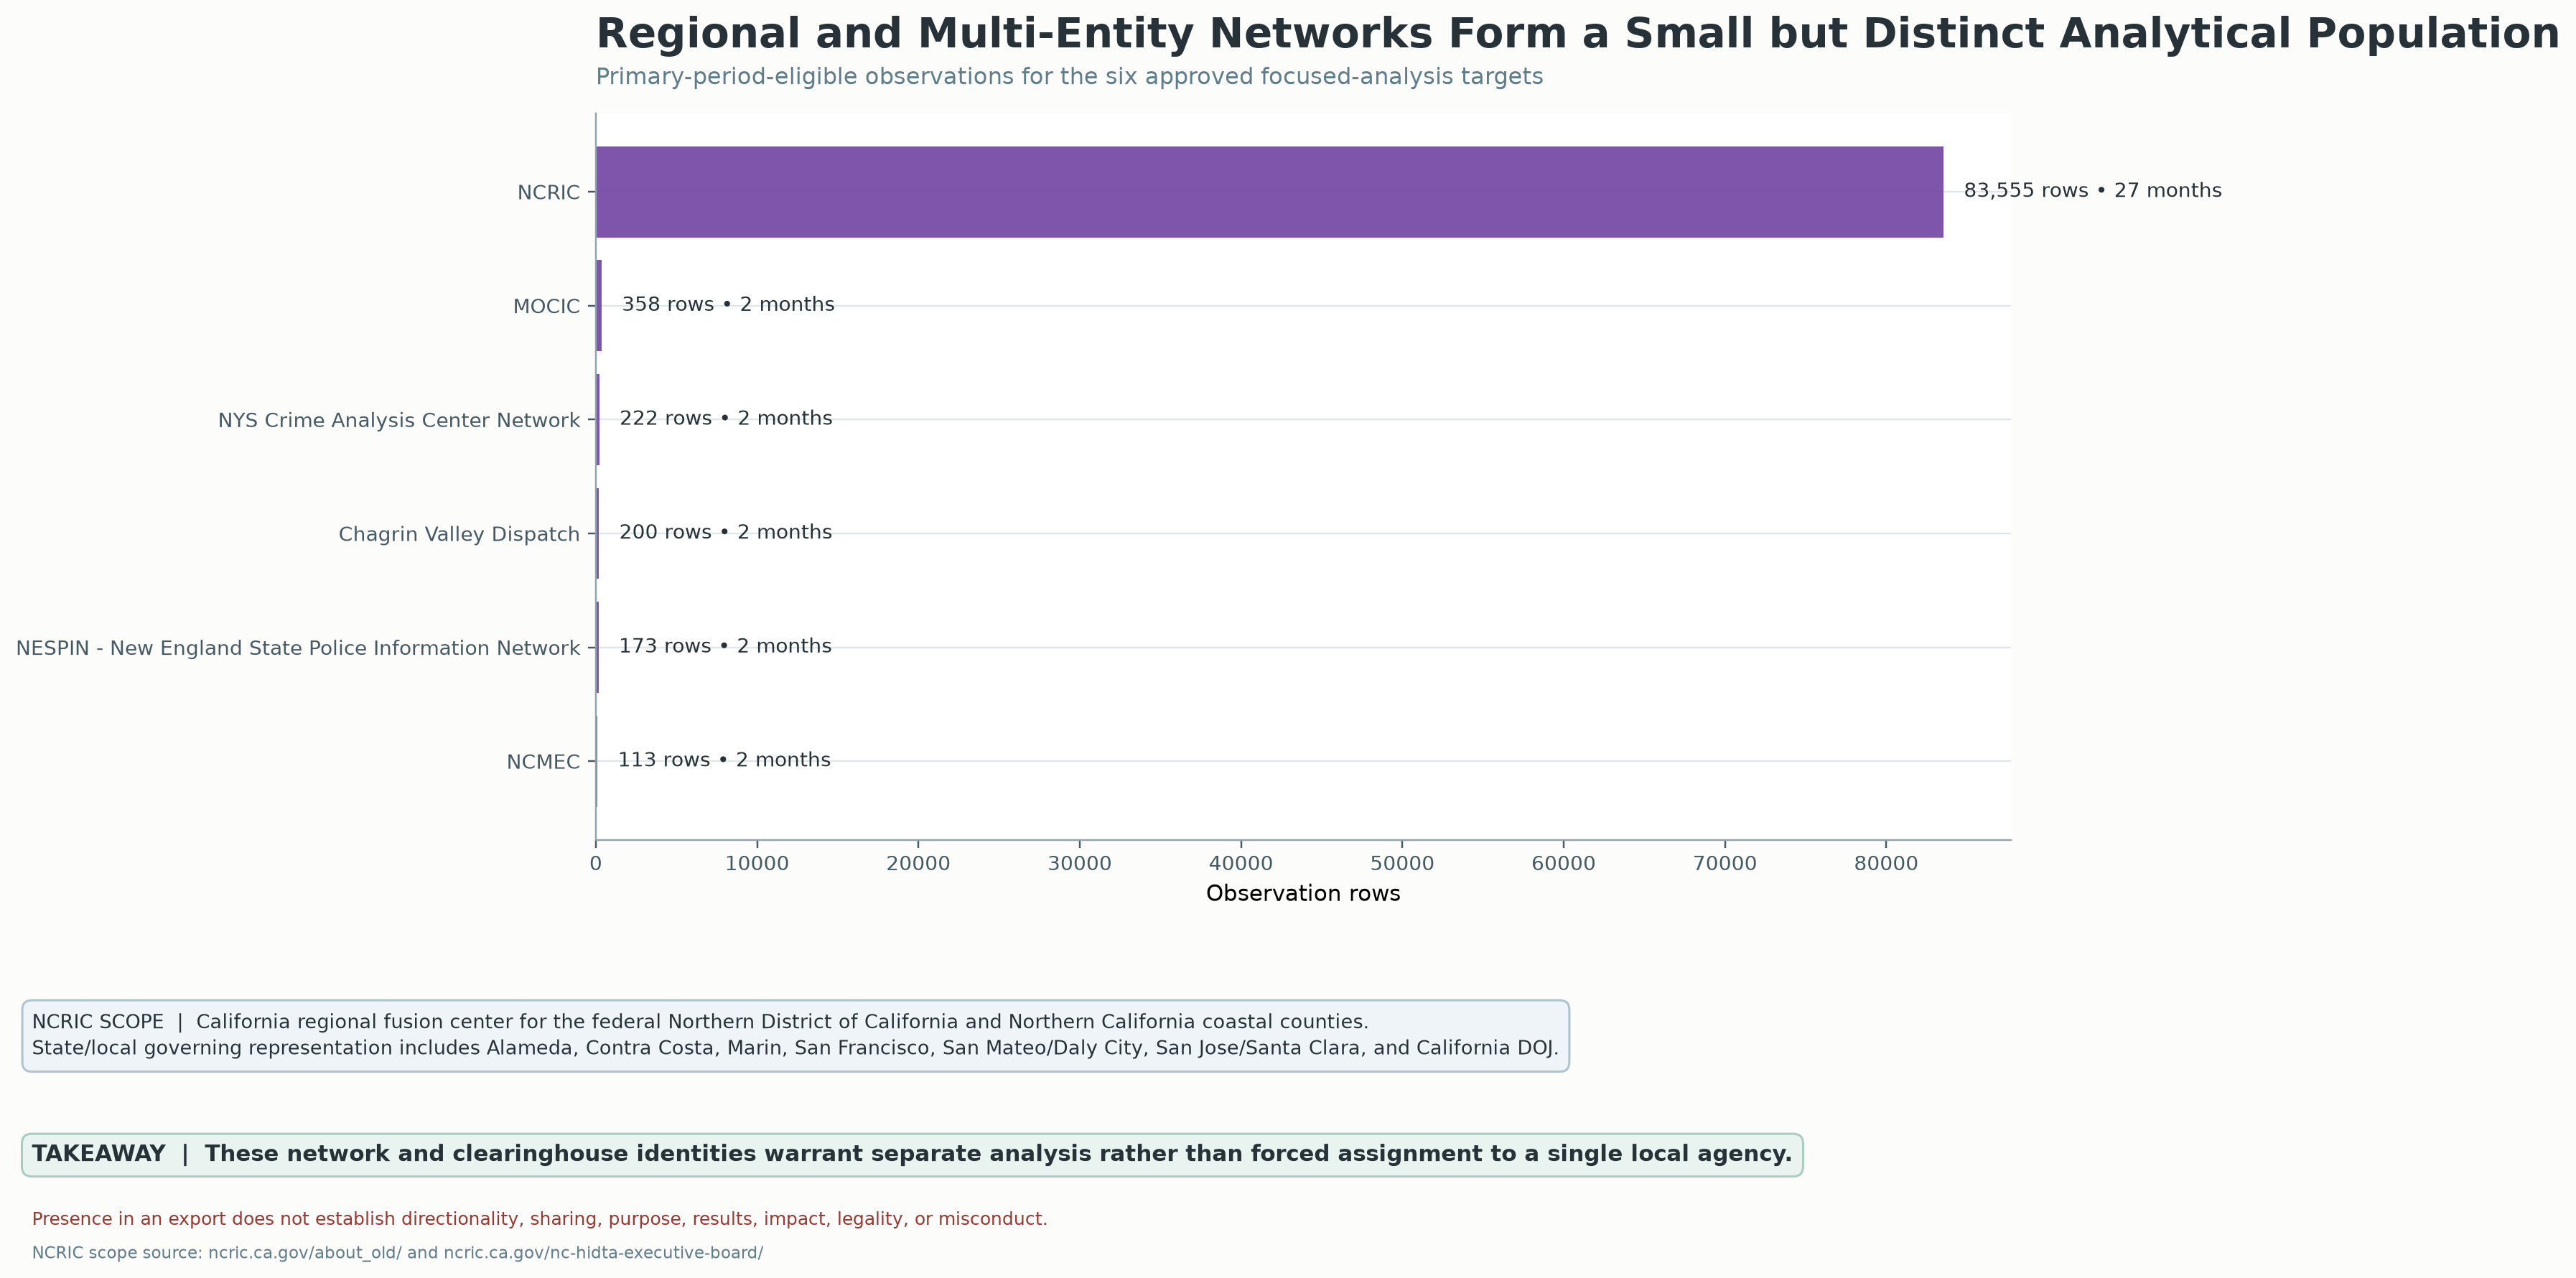
The graphic describes NCRIC as a California regional fusion center serving the federal Northern District and Northern California coastal counties. It cites NCRIC scope and governance pages. The comparison uses entries in the report’s eligible period for six selected networks.
Source: Praeva Analytics regional-network graphic; scope references: ncric.ca.gov/about_old/ and ncric.ca.gov/ncric-hidta-executive-board/. Underlying network export is not available here.
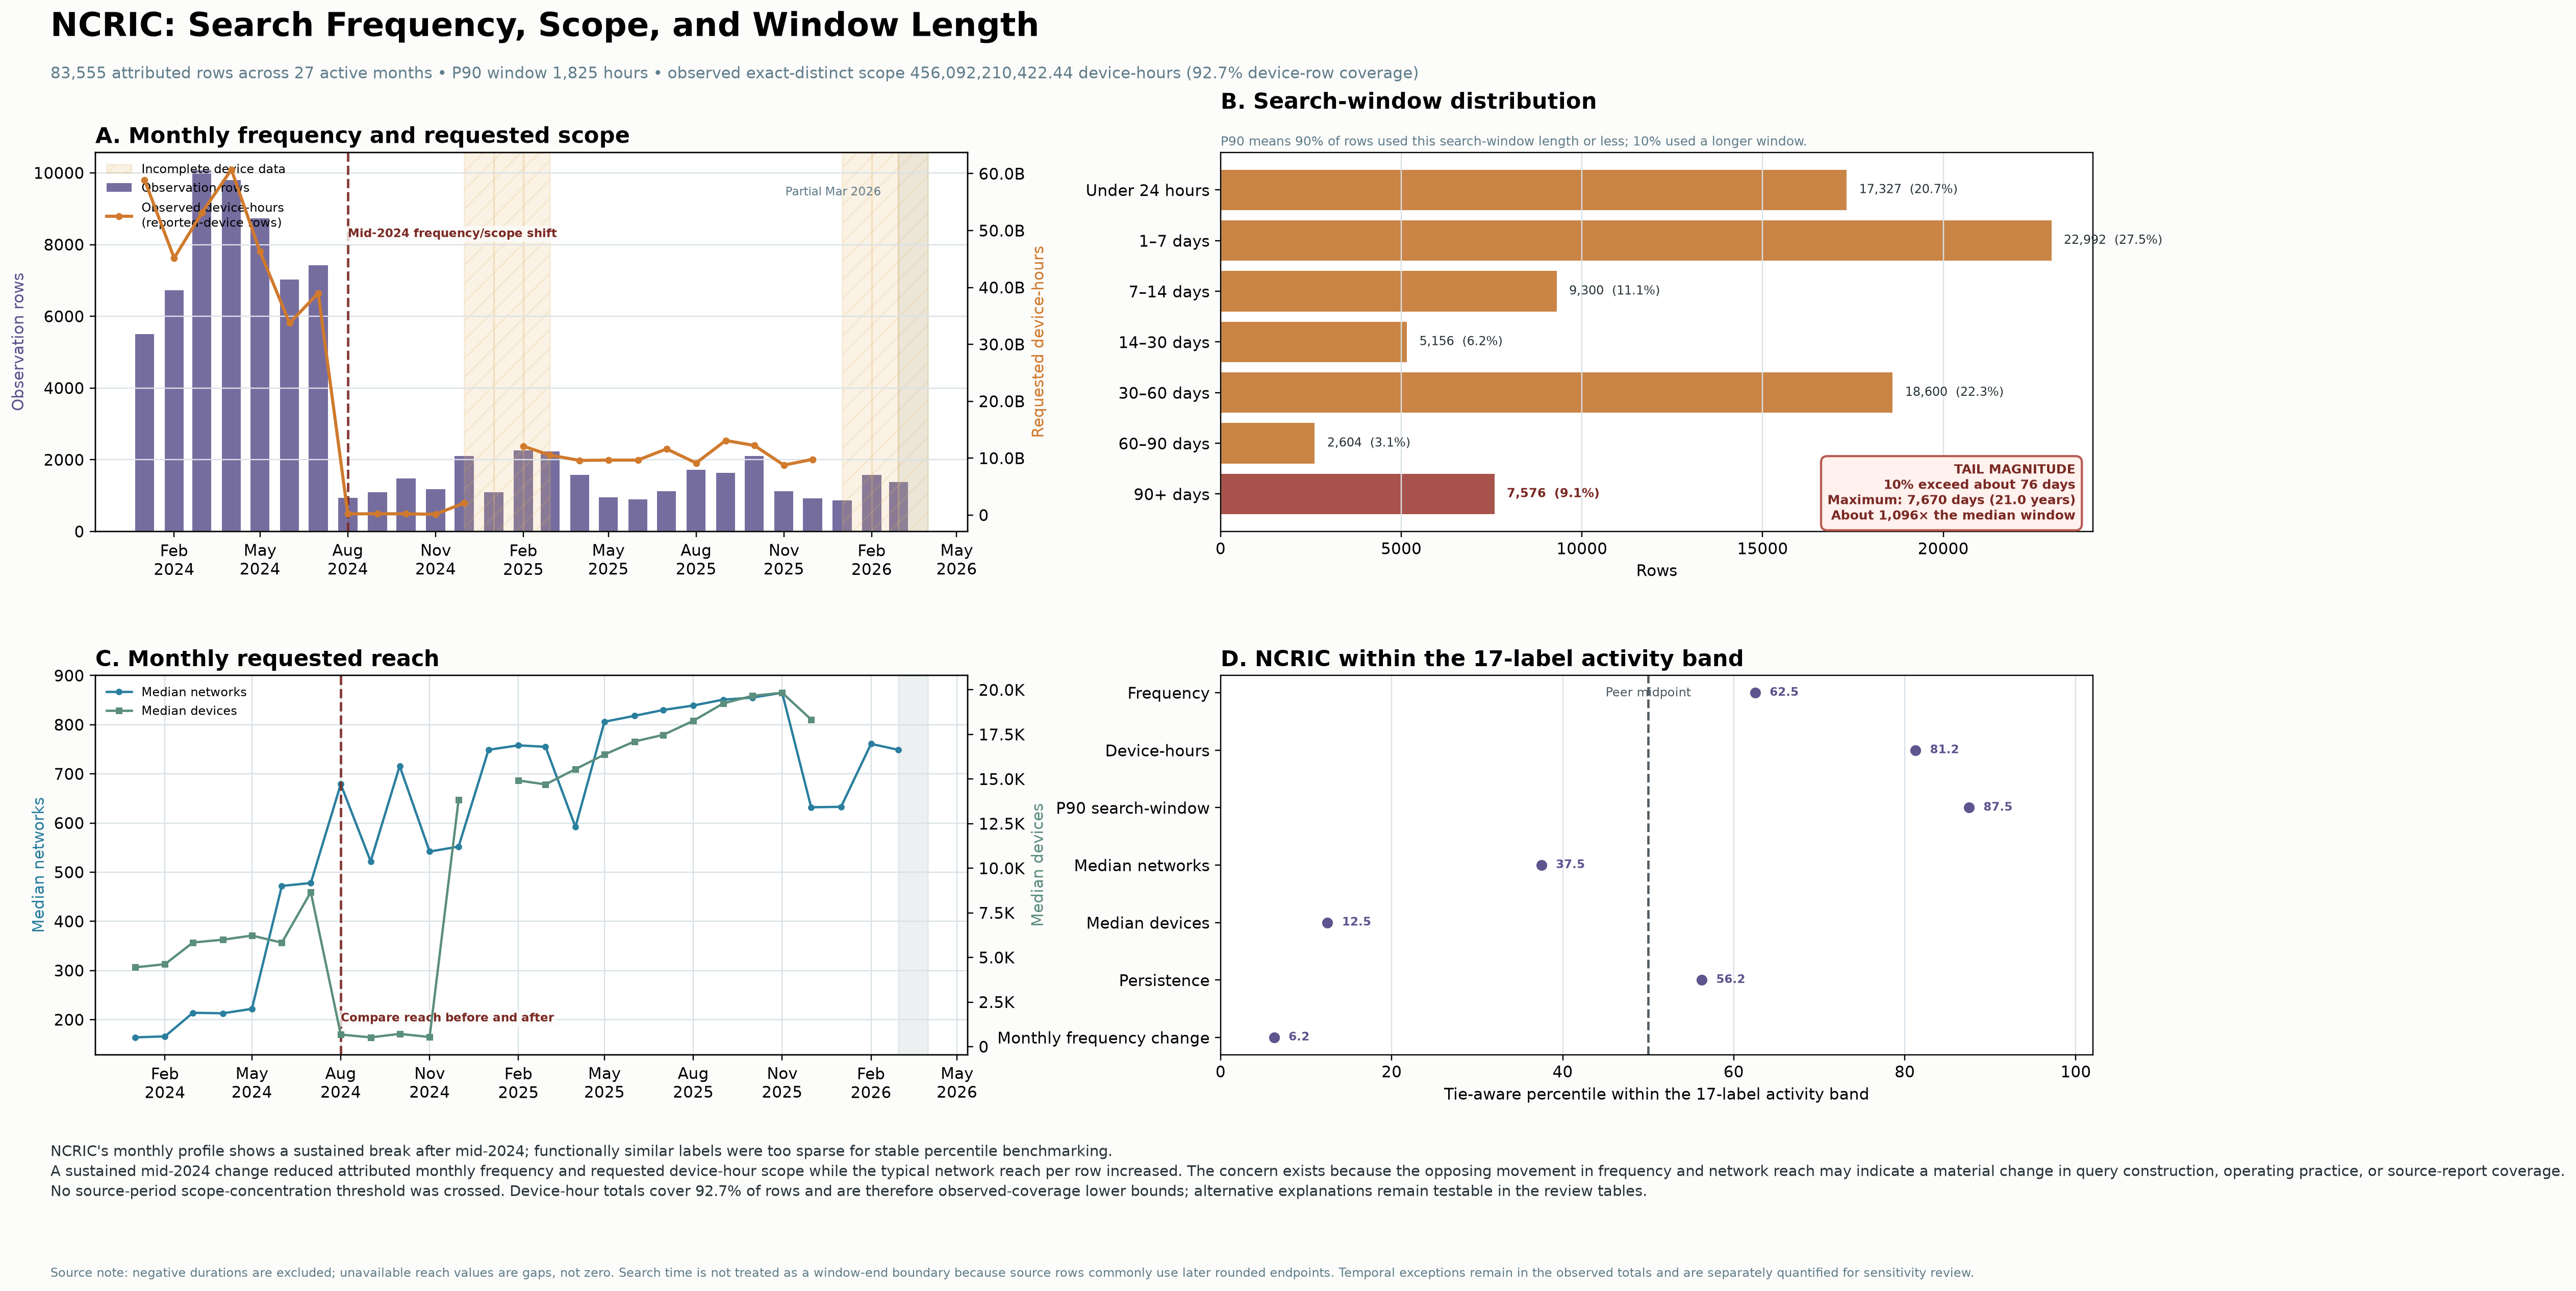
Monthly attributed rows, requested scope, requested windows and activity-band comparisons describe different dimensions. The graphic warns against treating the source-period scope concentration threshold as constant. Device-hour coverage is incomplete; time ranges represent requested windows. The profile identifies review questions about query construction, practice and export coverage.
Source: Praeva Analytics NCRIC profile; Civic Review Packet pp. 24–25 explains the mid-2024 change and possible source/reporting explanations. Query-level data and original export are not available here.
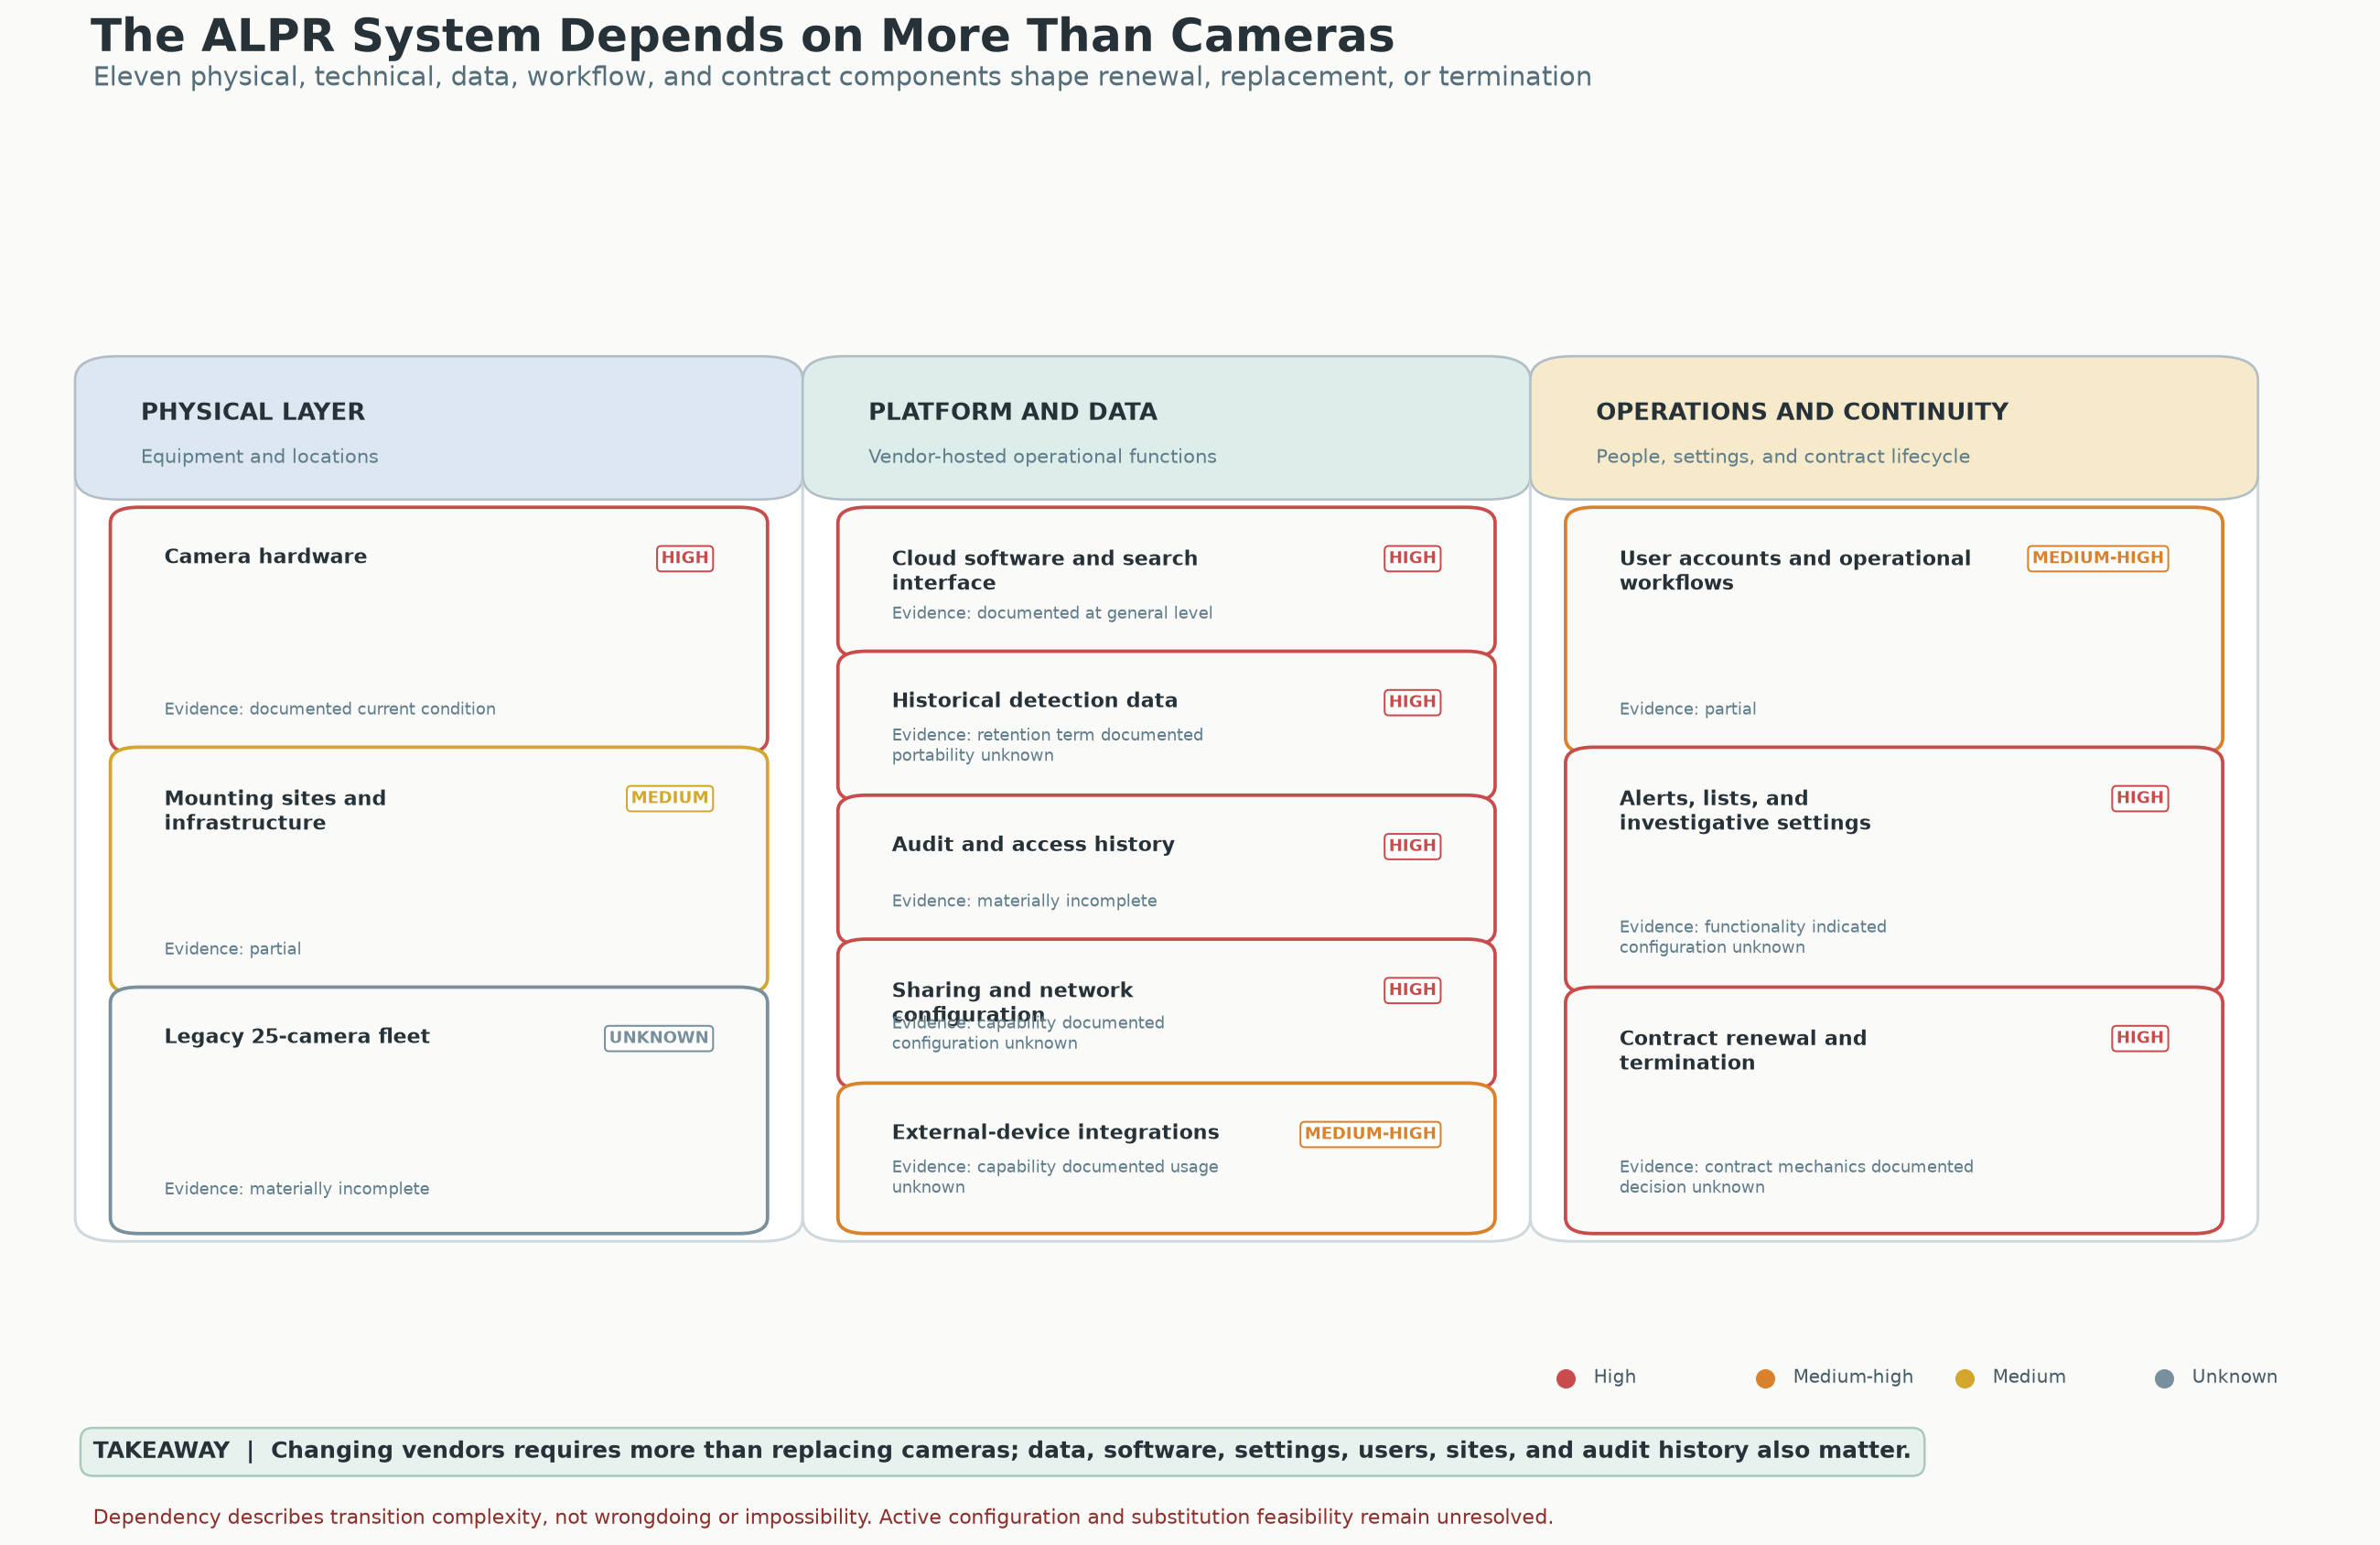
The original graphic maps dependencies across the physical layer, platform/data, and operations. Its ratings describe transition complexity. Active configuration and substitution feasibility require further records.
Source: Praeva Analytics capability-dependency graphic accompanying the analytical report.
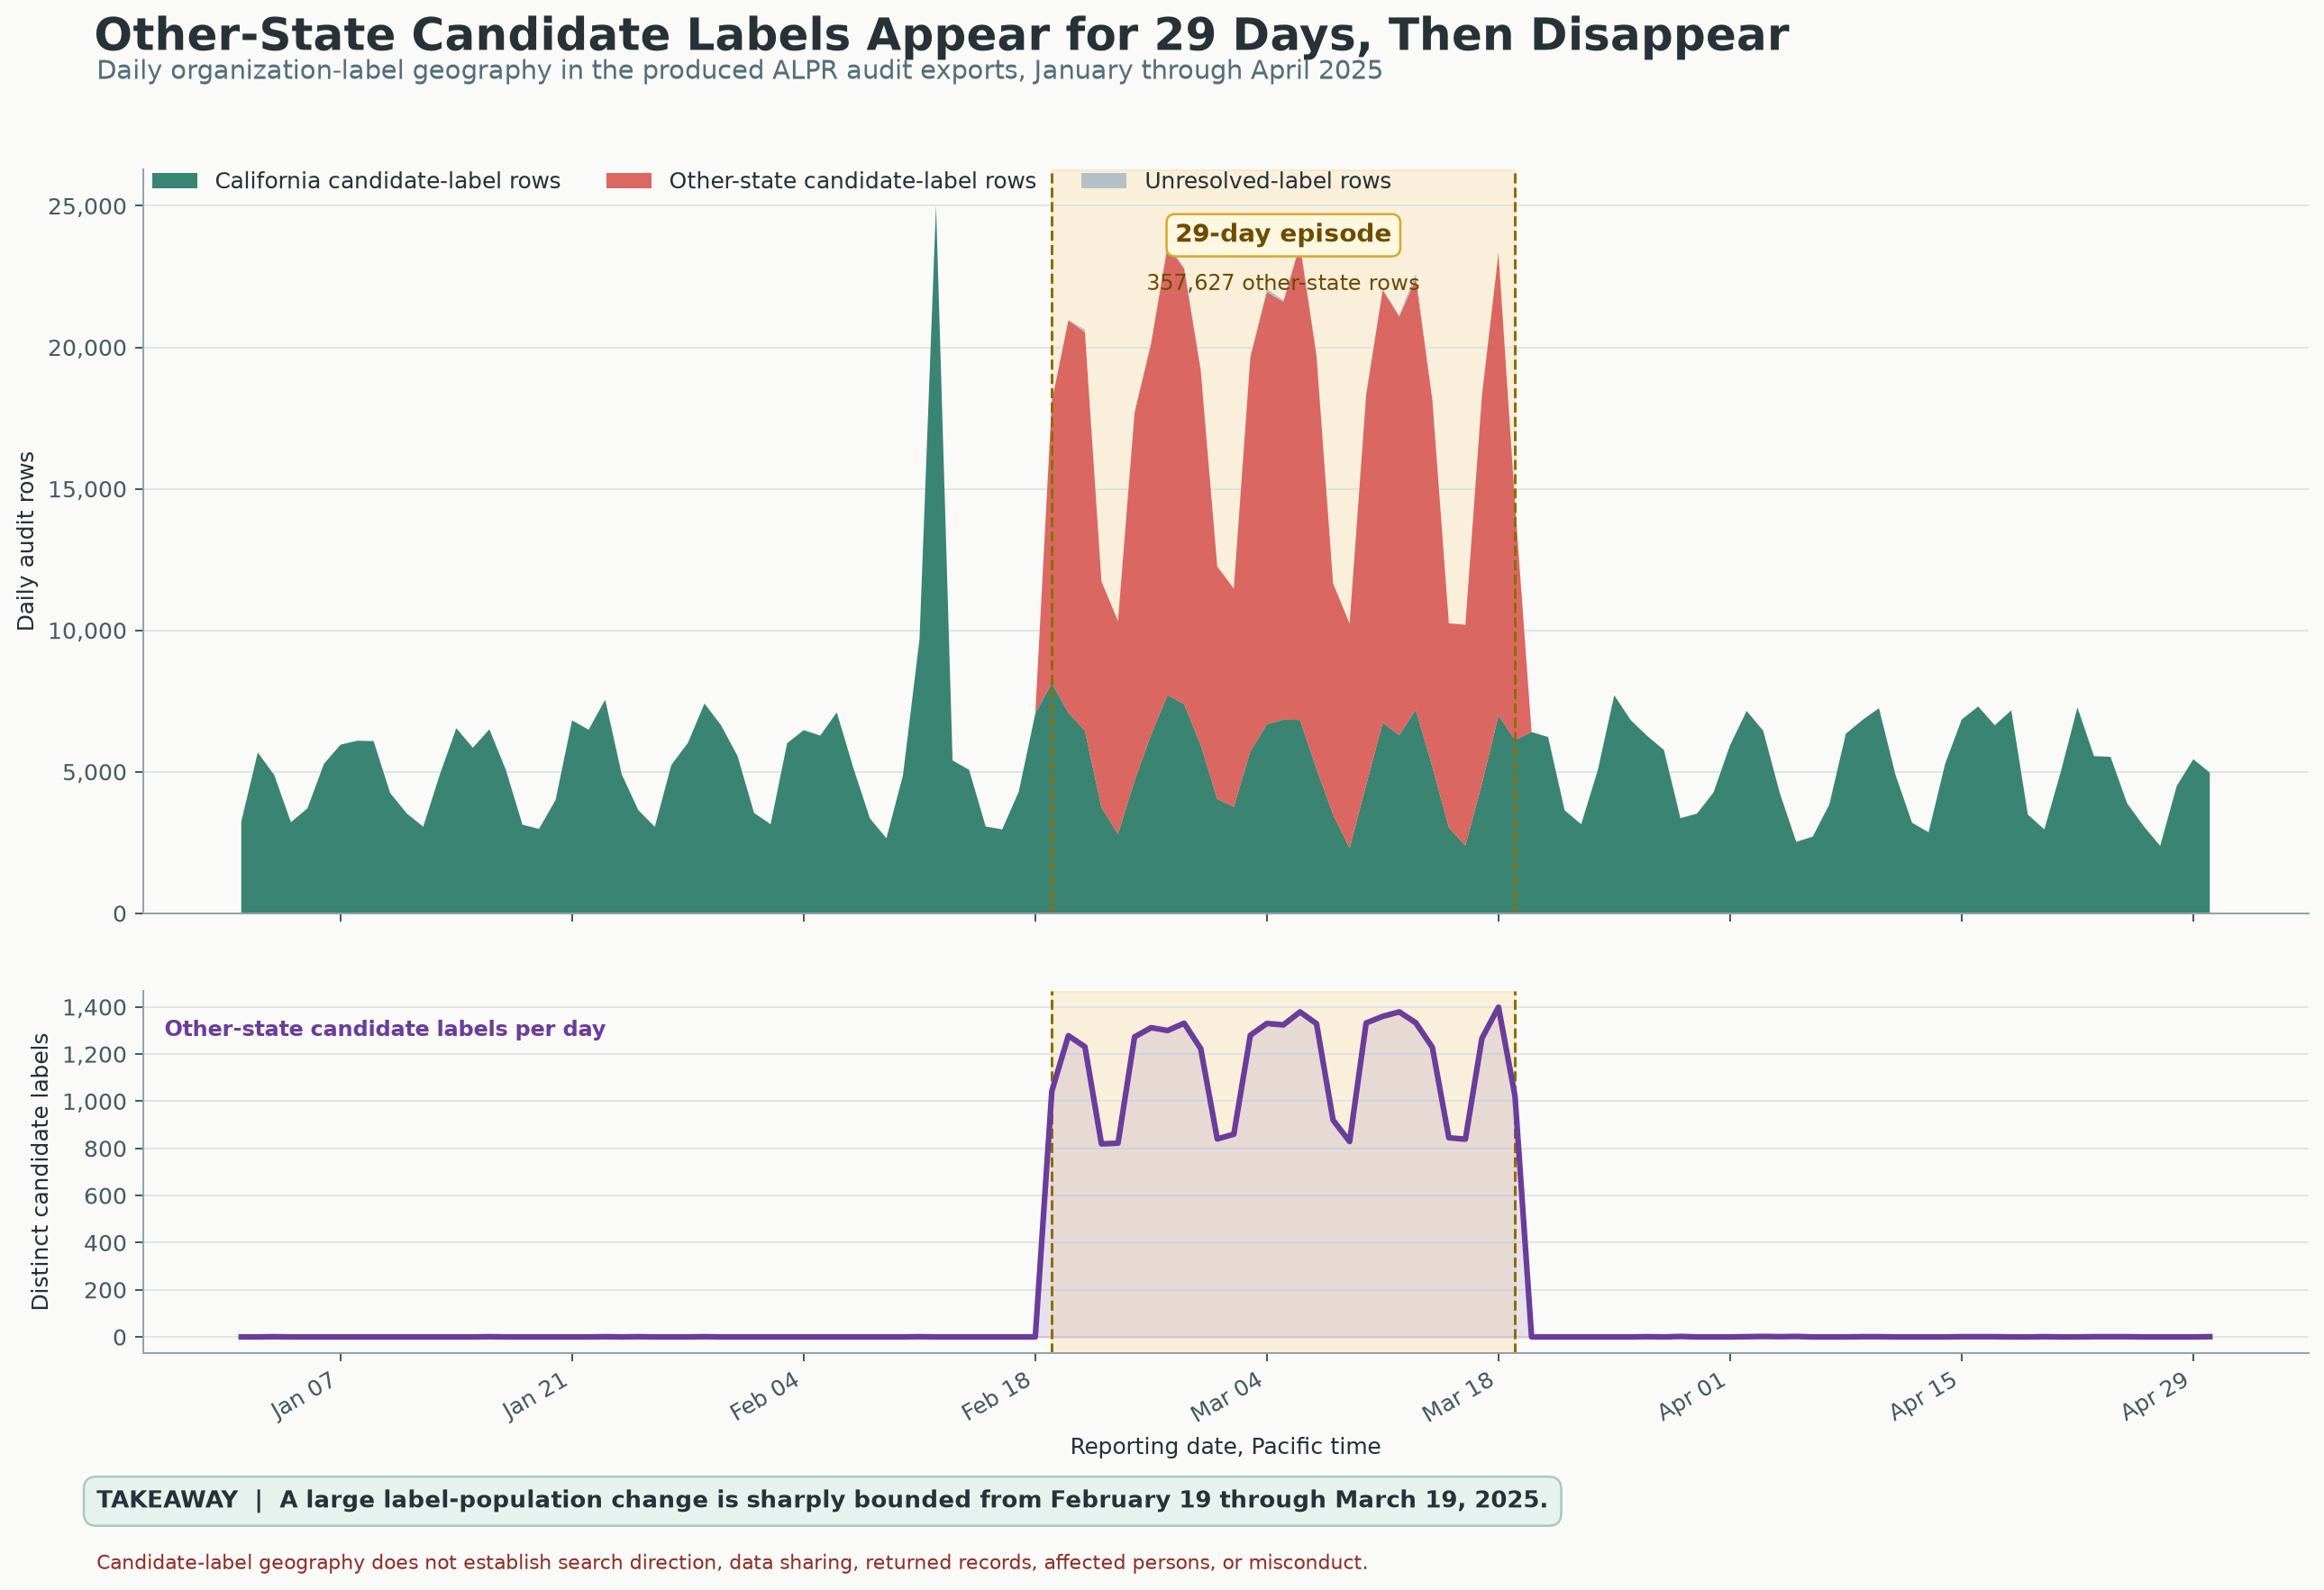
The upper panel shows daily audit rows; the lower panel shows distinct other-state candidate labels. Both identify the same bounded interval.
Source: Praeva Analytics daily graphic; Flock exports analyzed in daily_regime.json.
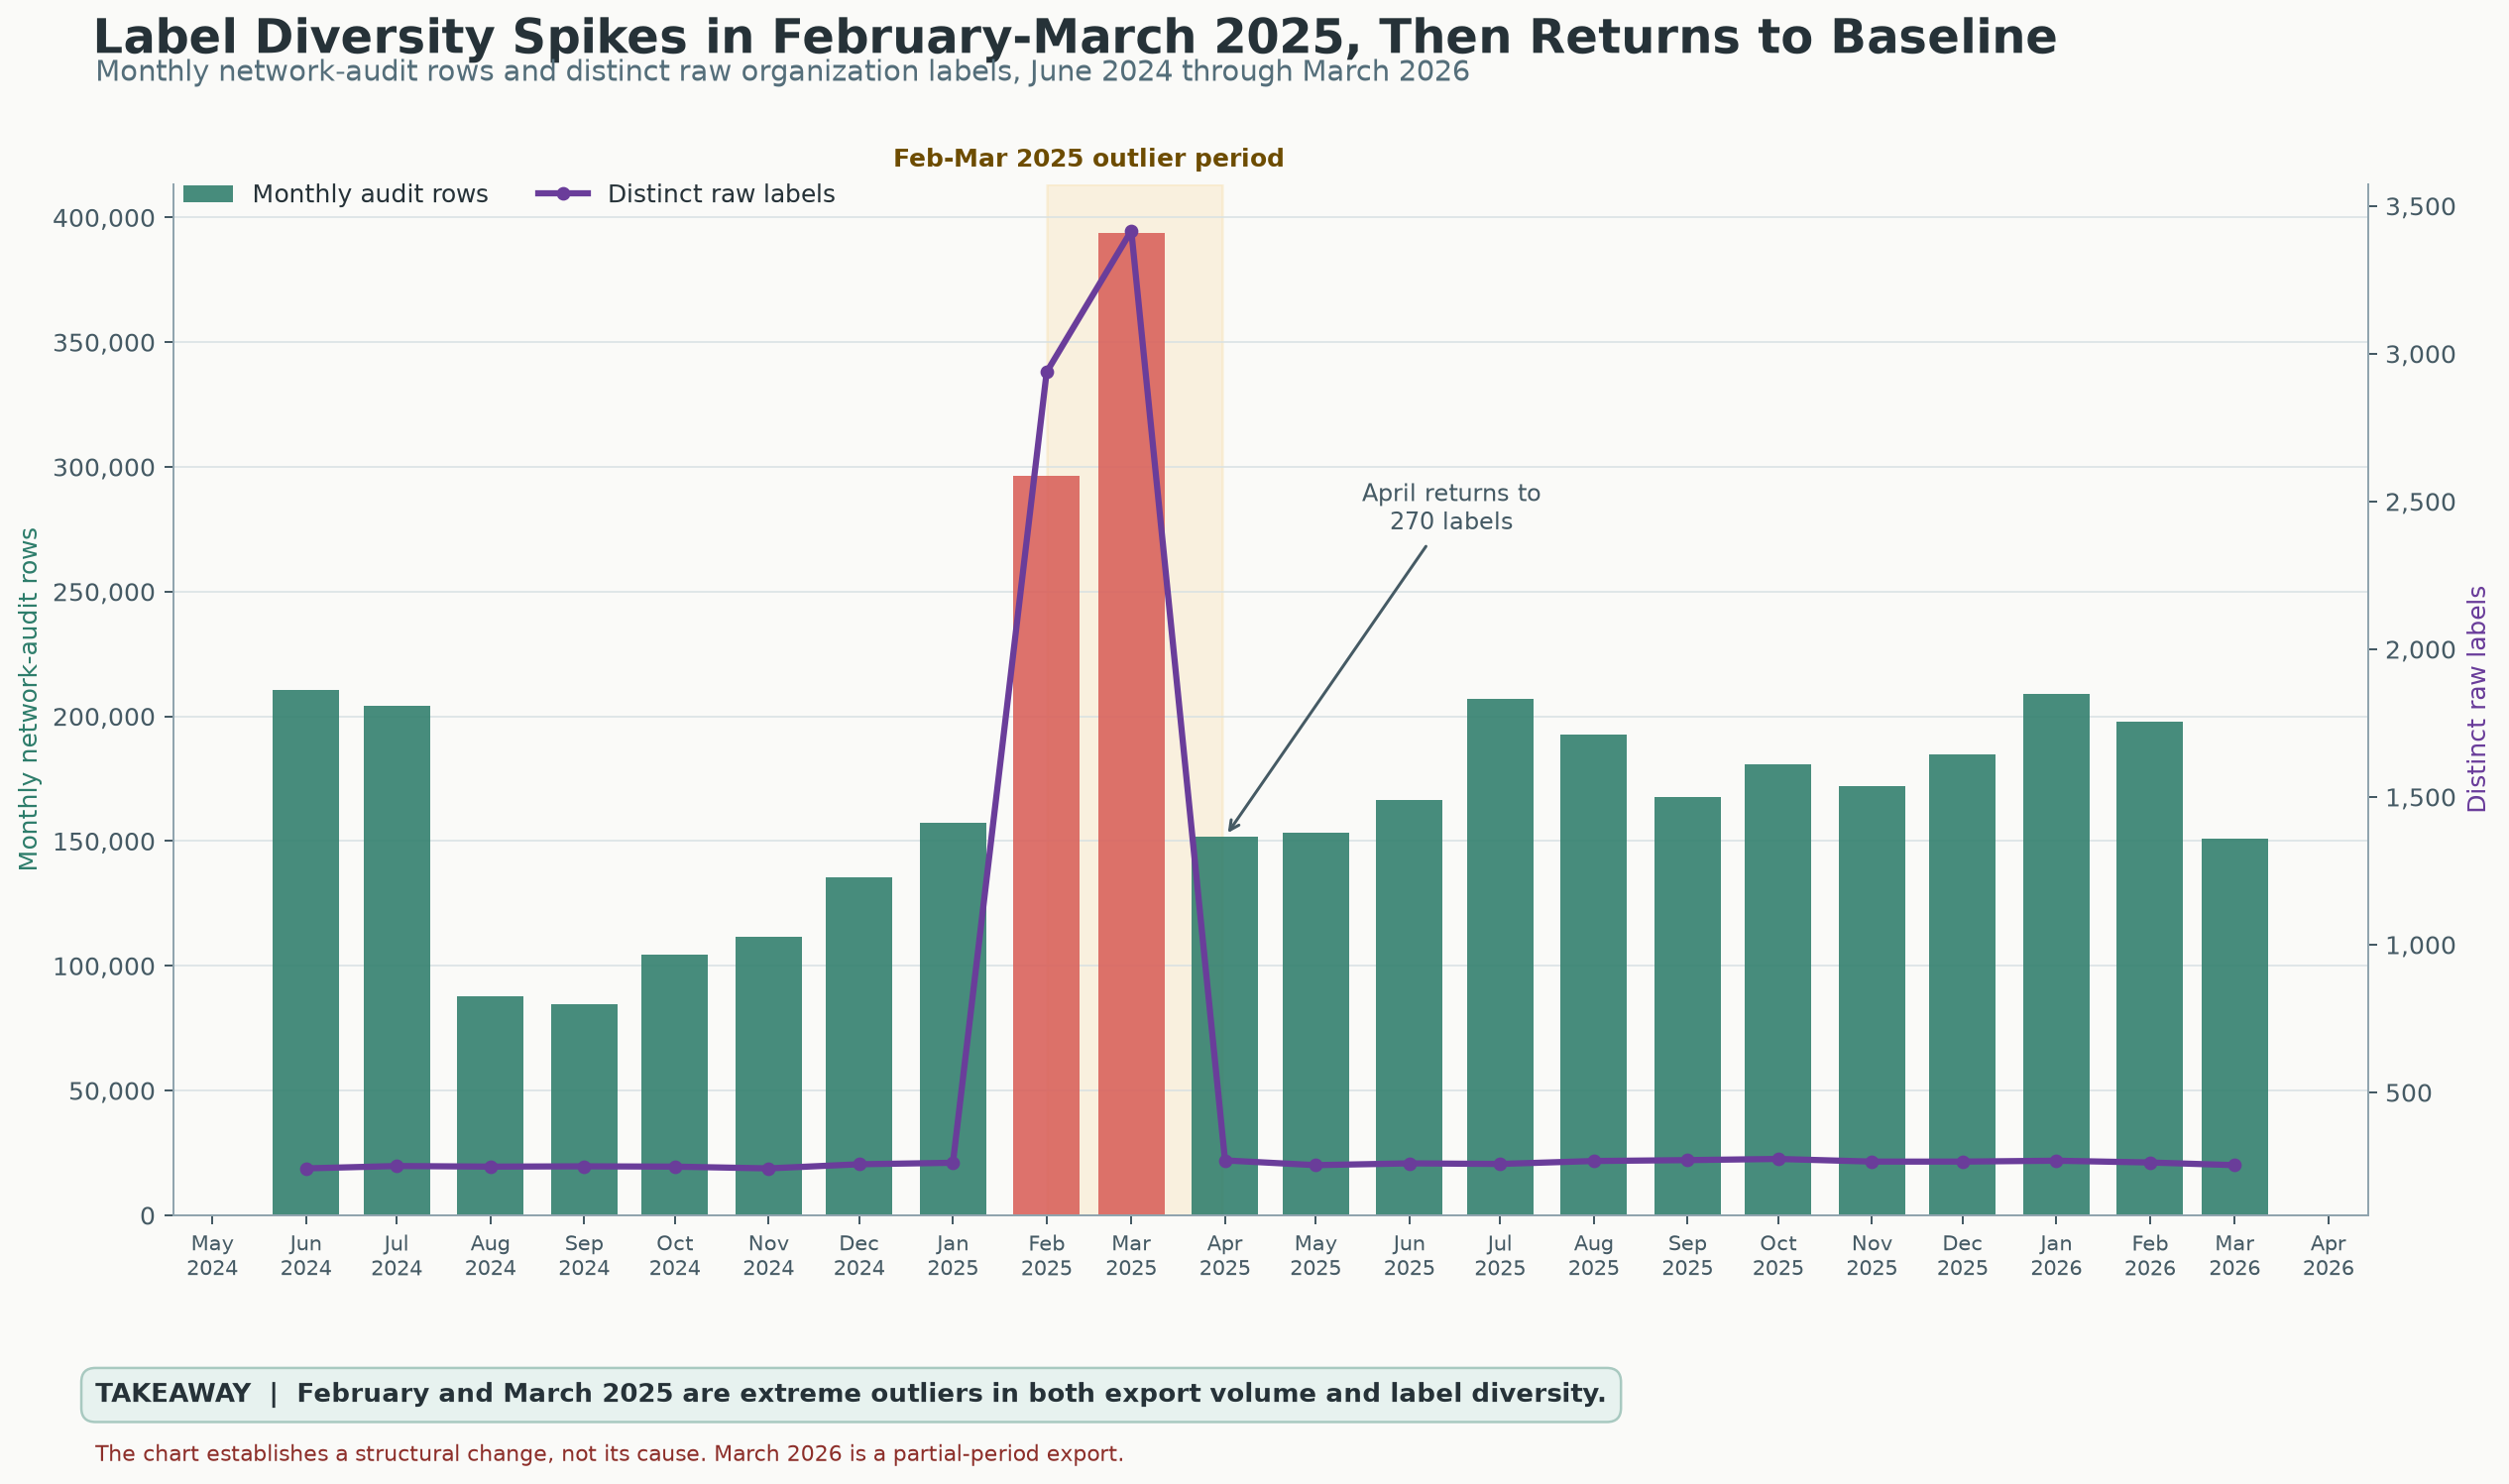
Bars count monthly network-audit rows; the line counts distinct raw organization labels. These are exported populations, not verified people, searches, recipients or search direction. The chart establishes structural change, not cause. March 2026 is a partial-period export.
Source: Praeva Analytics monthly graphic and monthly_network.json.
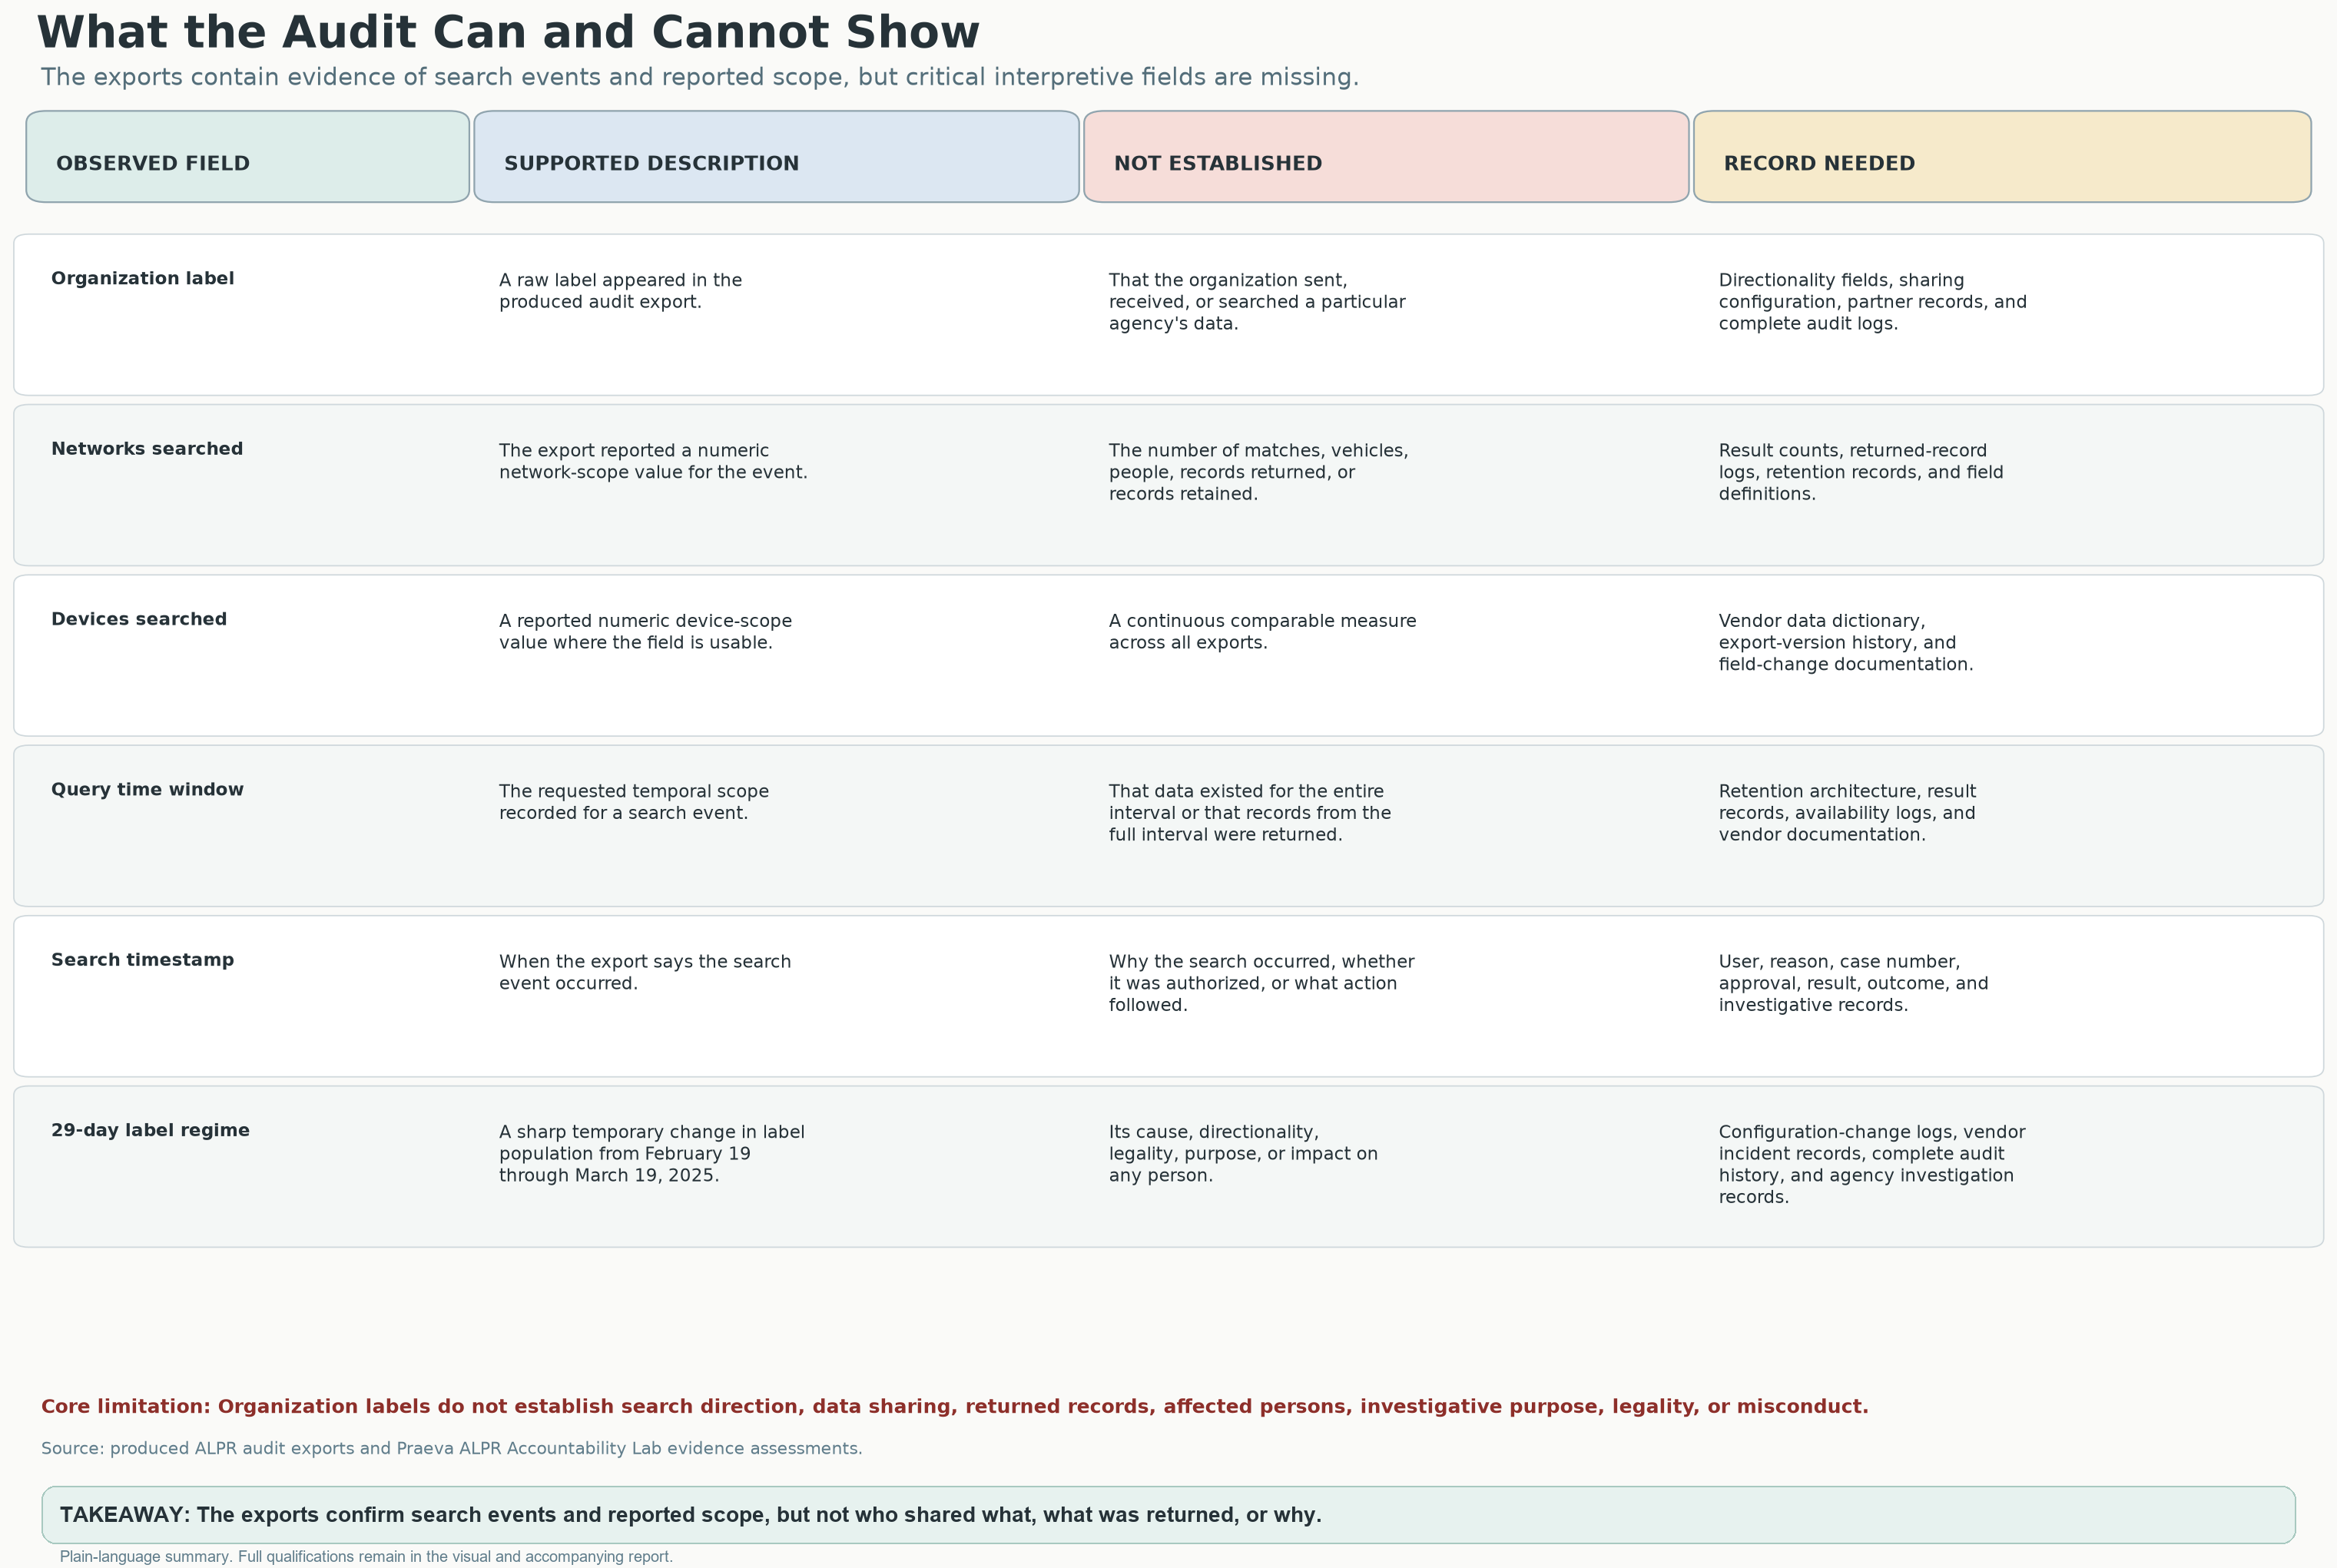
The original matrix organizes documented observations, interpretations and the records needed to answer questions about access, sharing, purpose and results.
Source: Praeva Analytics evidence-boundary matrix accompanying the report; original exports are not available here.
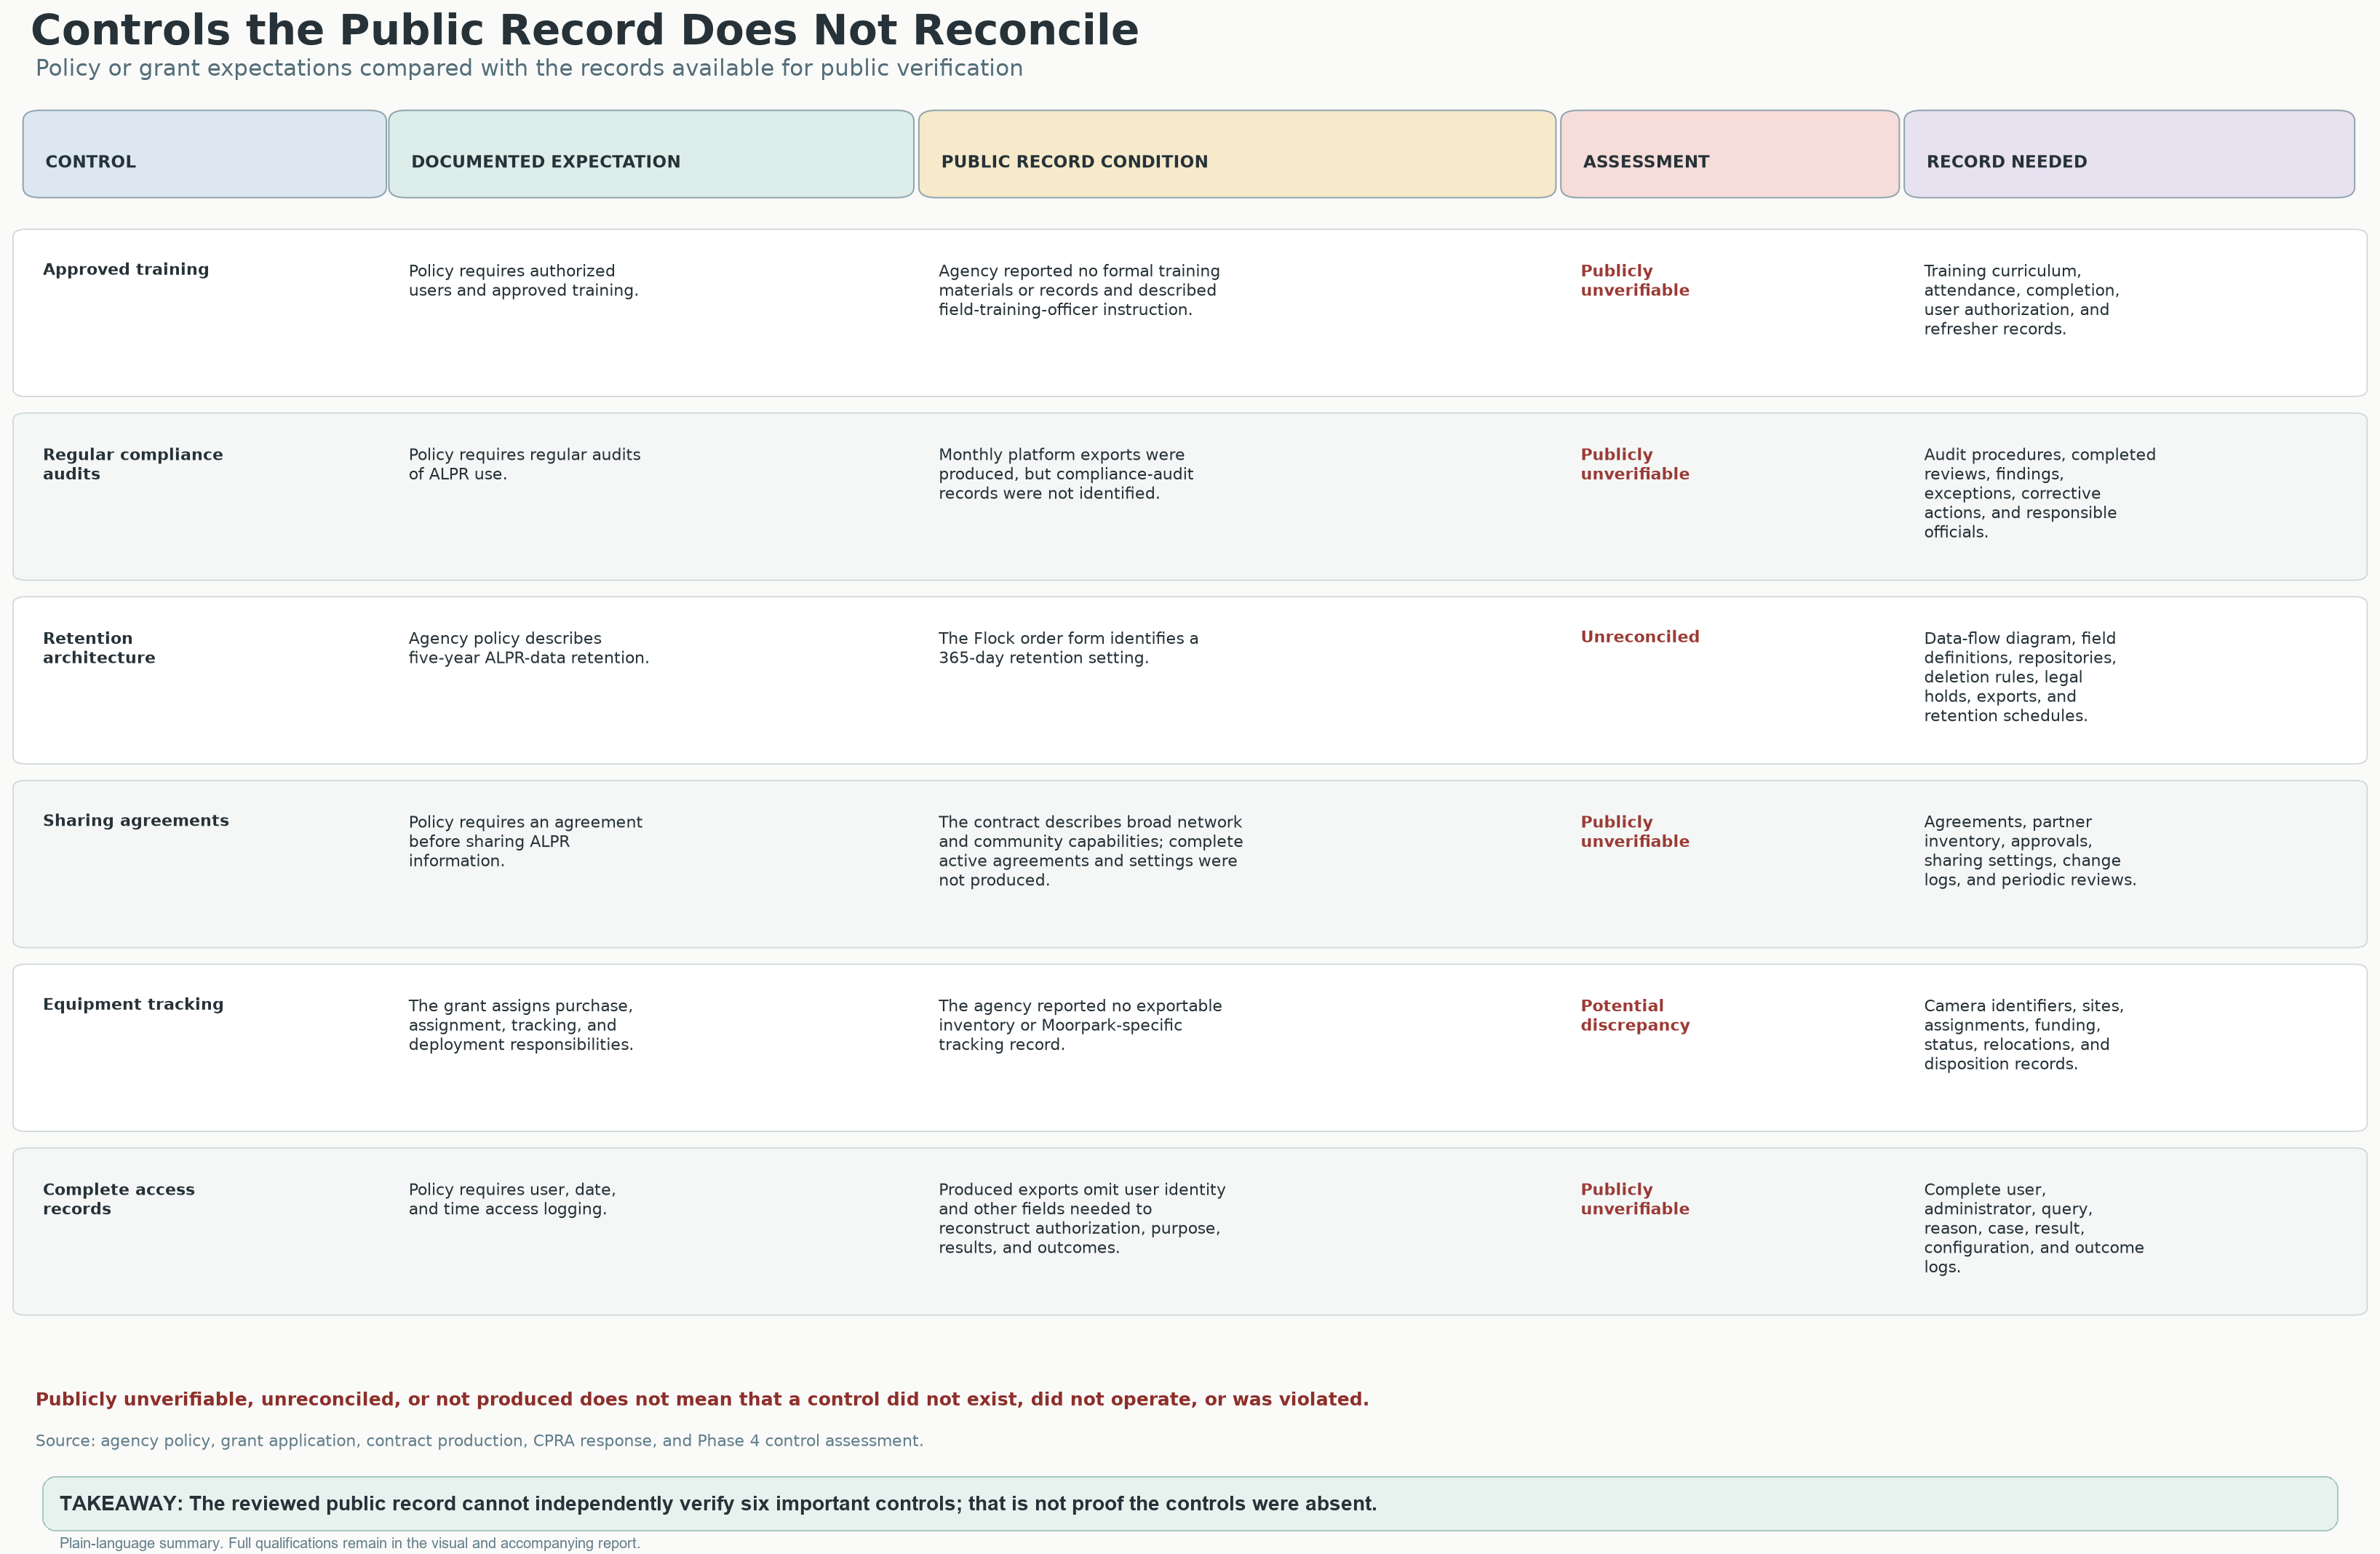
The original comparison covers training, compliance audits, retention, sharing agreements, equipment tracking and complete access records. The accompanying policy and contract references require repository-specific reconciliation.
Source: Original Praeva Analytics public-control reconciliation graphic; project analysis of policy, grant, contract and public-records materials.
ANALYSISExplained in the report; original agency-by-agency data not included
In several groups, VCSO ranks high for how often it appears and how far back its searches looked. The comparison is more mixed for how many networks and cameras its searches typically could reach.
| Comparison group | Number of agencies | Why compare them? |
|---|---|---|
| California sheriffs | n = 40 | Agencies with a similar role |
| Activity band (0.5×–2× VCSO) | n = 4 | Similar activity totals, not necessarily similar duties |
| Population band (±25%) | n = 4 | Agencies serving similarly sized populations |
| Nationwide sheriffs | n = 848 | A broader comparison |
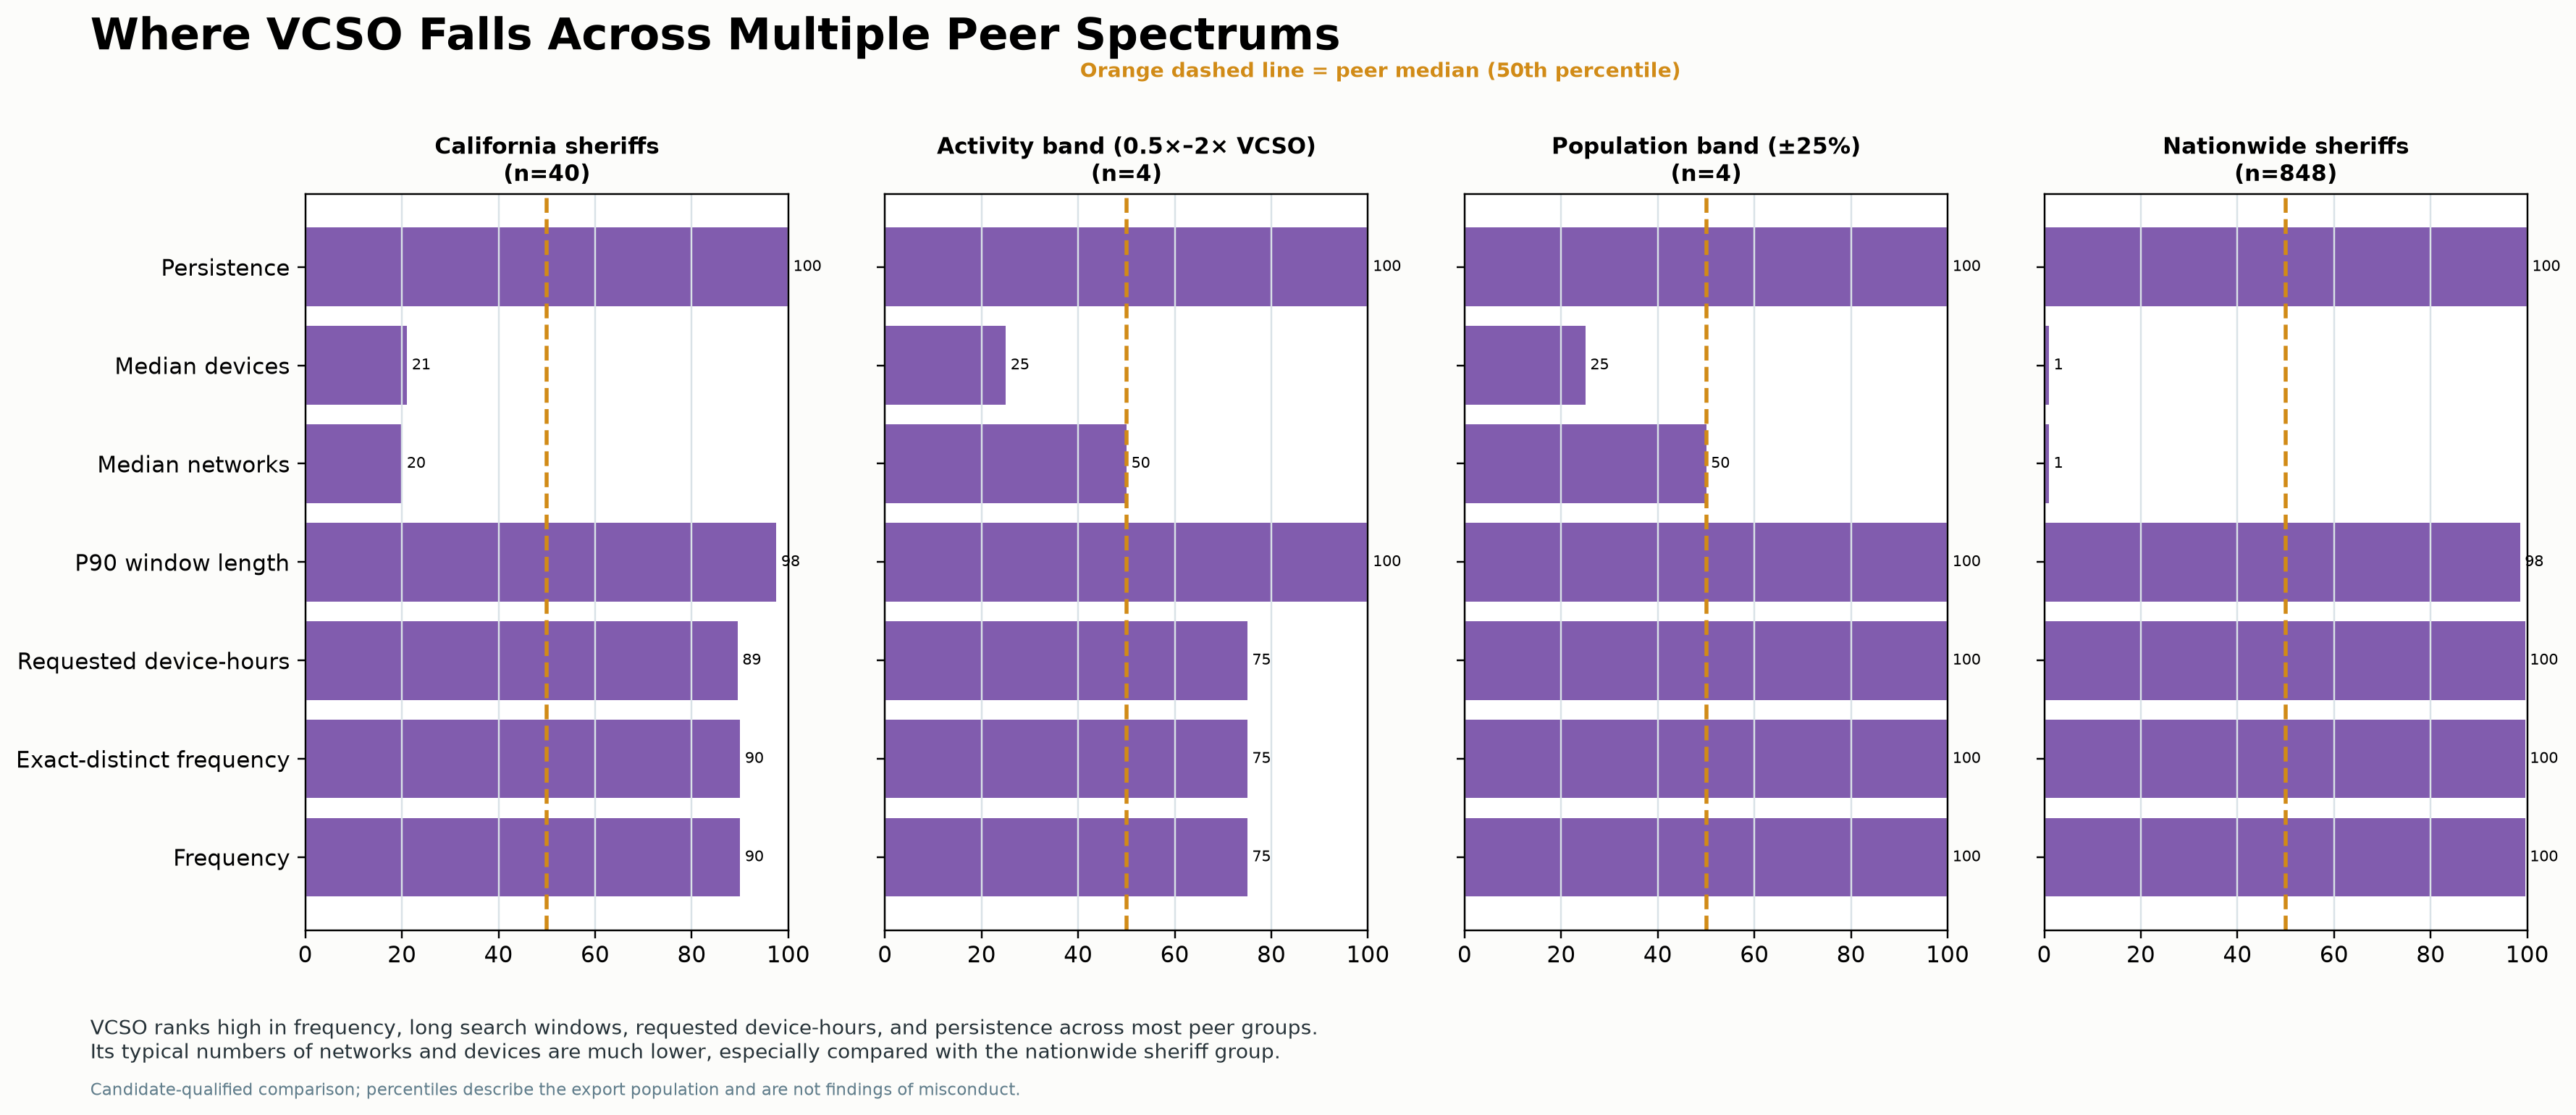
The four panels compare California sheriffs, an activity band, a population band and nationwide sheriffs. Cohorts vary greatly in size, so percentile rankings are not interchangeable. These candidate-qualified comparisons describe the export population.
Source: Praeva Analytics peer-percentile graphic; Civic Review Packet pp. 10–11 and methods p. 31. Comparison-group definitions and sizes appear in the image; raw membership and metric tables are not available here.
These rankings describe the comparison, account for ties and are not grades. Small groups can change greatly when different agencies are included. The full agency lists and how they were grouped still need to be checked.
Source: Civic Review Packet, pp. 10–11 and methods p. 31. Report explanation, not raw comparison-group data.
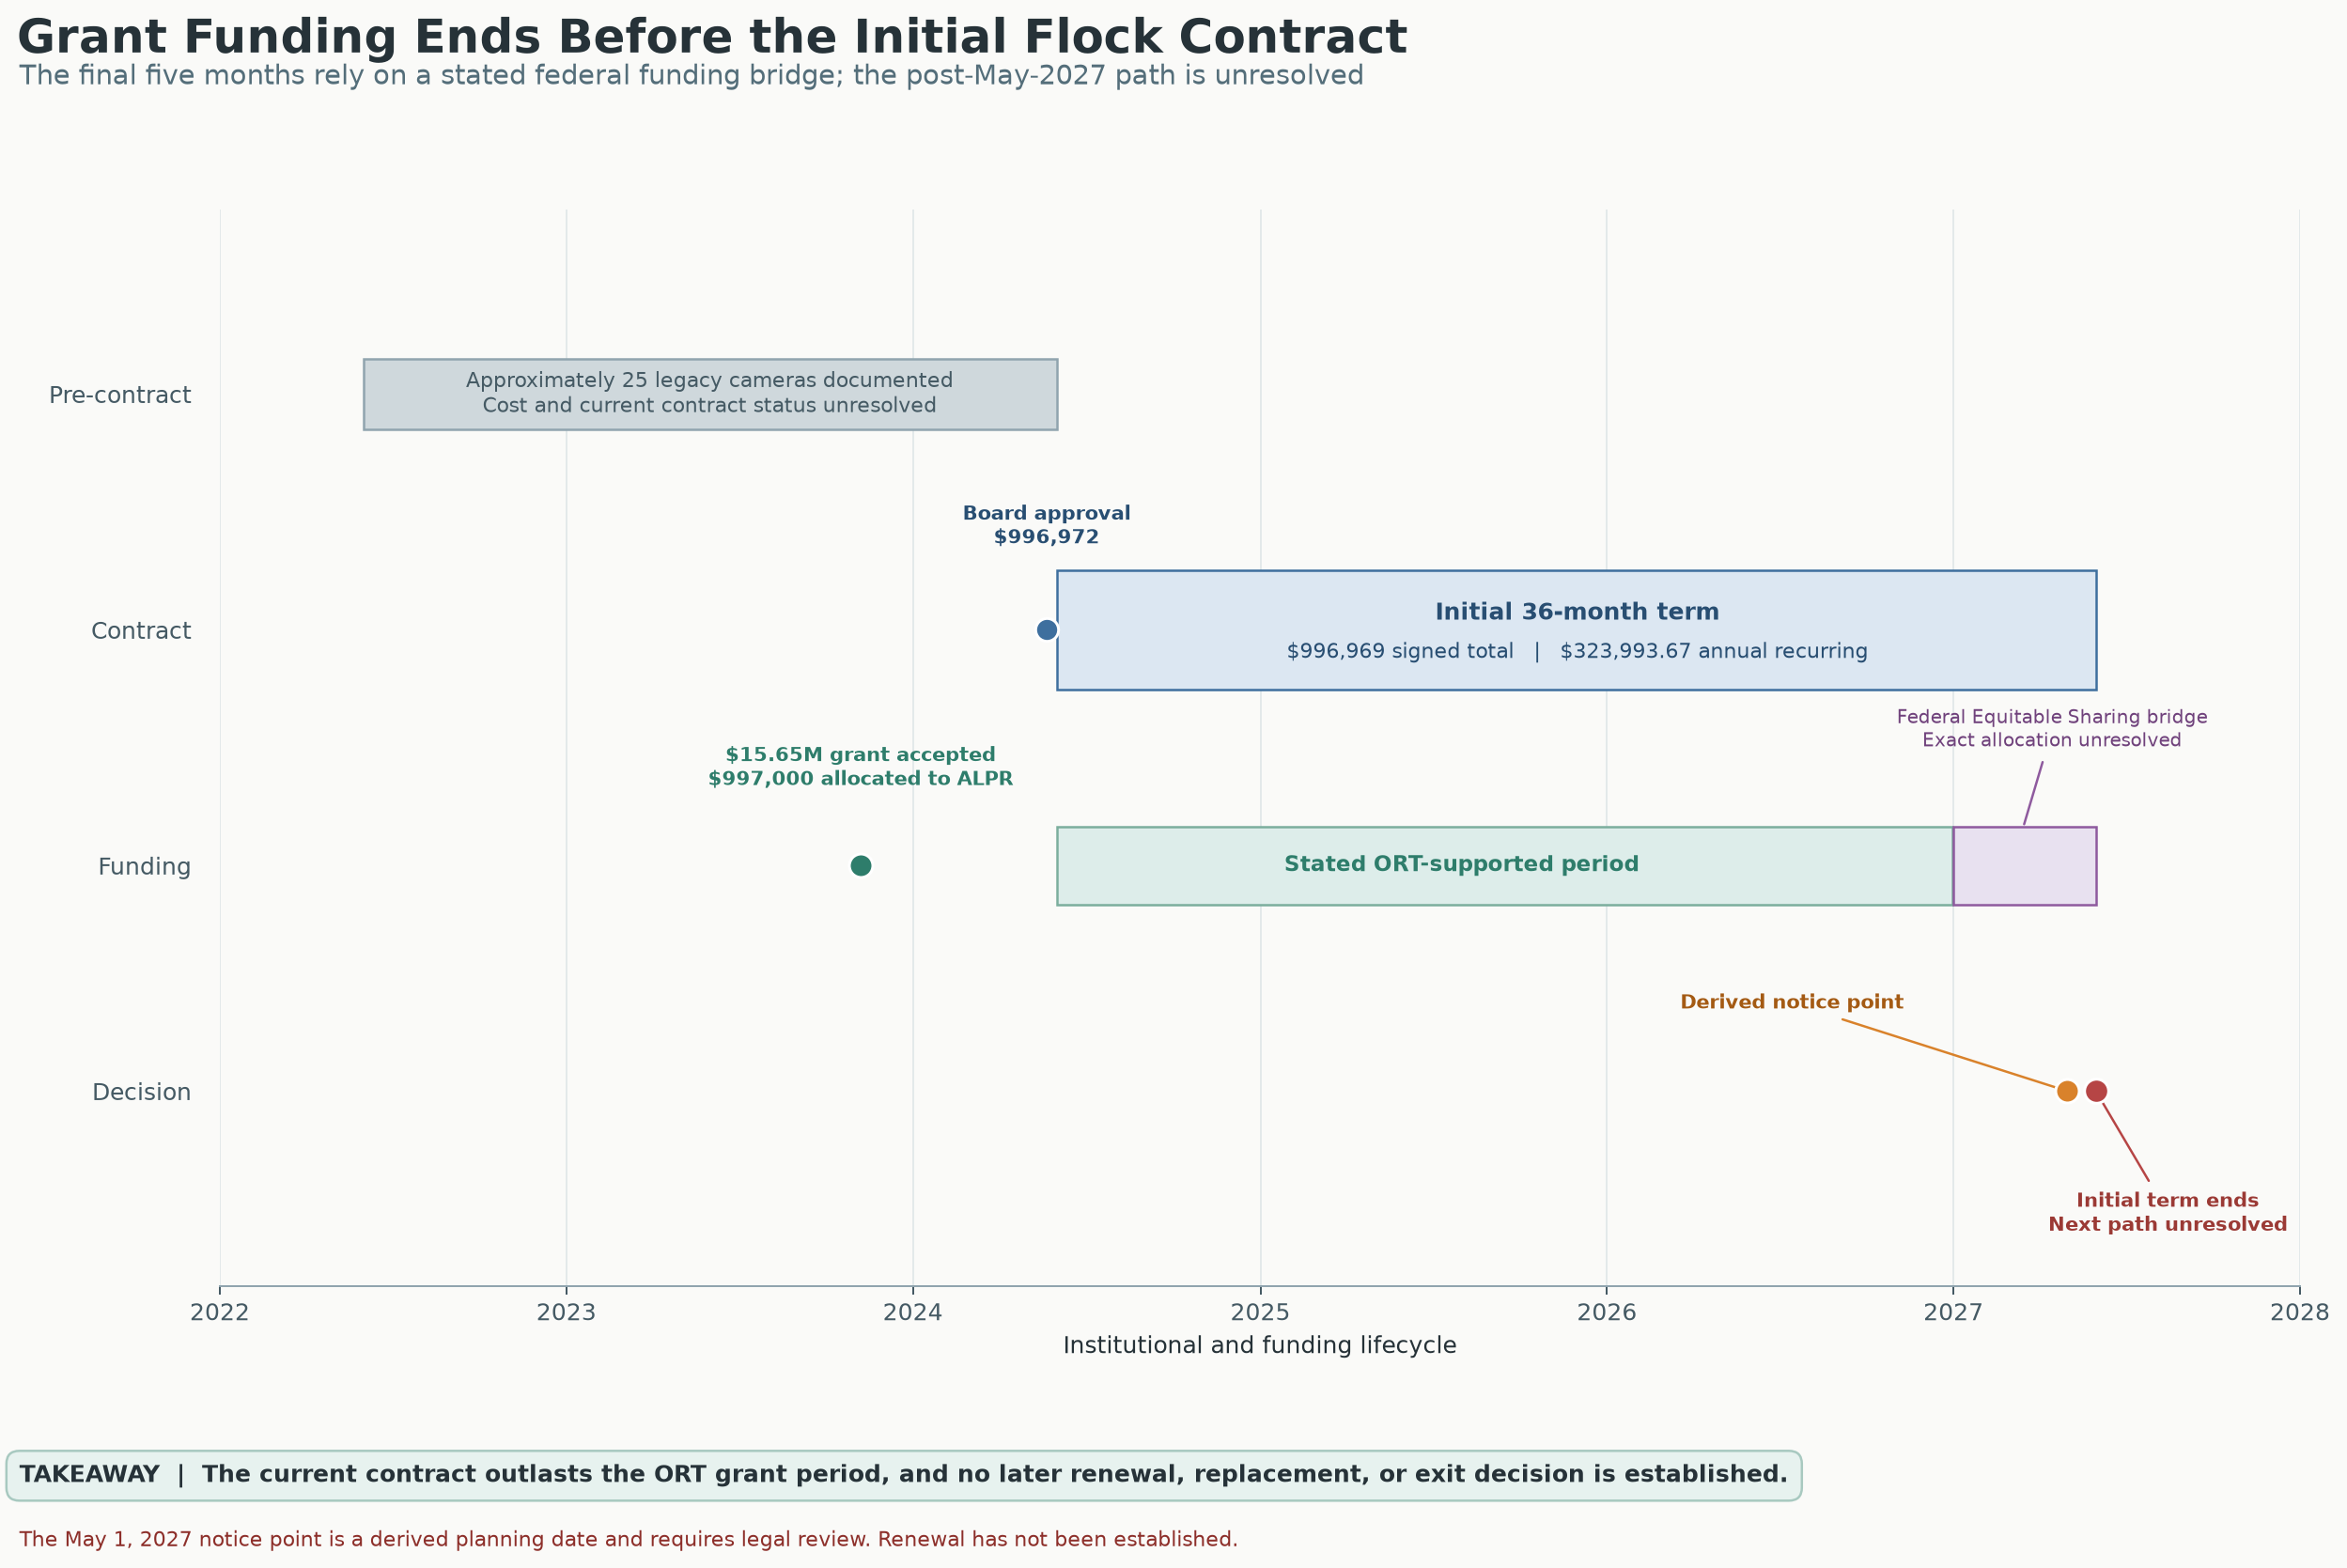
Read this project-provided timeline alongside the report and legal receipts; it is not a substitute for the original procurement, grant or contract records.
Source: Praeva Analytics funding timeline accompanying the analytical report.
Each link opens its original image, without cropping or recompression.
These seven editorial graphics accompany the investigation. The notes distinguish measured findings from illustrated claims that remain unverified.
DOCUMENTED Official Ventura County Sheriff’s Office report, dated April 22, 2026, covering January 1–December 31, 2025. Its reported inventories and usage are agency-reported figures, not independent operational verification.
UNRESOLVED 70 “Homeless related operations”: What did those drone operations involve? Who approved them? How long was data kept, and which systems could receive it? These events cover the overall program, not Wingtra alone.
UNRESOLVED 81 Organized Retail Theft operations. What UAV workflows and safeguards were used? The report does not document any relationship between these UAV events and Flock or Axon.
UNRESOLVED Approximately $15,229 for “network video upgrades, enhanced recorders and associated equipment.” This appears under ROOK/tracked-armored-vehicle equipment costs, from the existing FY 25/26 budget (printed page 5; PDF page 6). Ask what equipment and governing rules it covered. The report does not establish a relationship to ALPR, Axon or Fusus. It is a follow-up lead only.
The Chapter 8 comparison is a governance recommendation, not a claim that ALPR is covered by AB 481 or that a statutory reporting violation occurred.
The graphics illustrate possible connections, not a verified local system map. Vendor capability is not confirmed VCSO deployment. The cell-site-simulator purchase and integration remain unverified.
This is a conceptual illustration, not a verified feature inventory for a particular ALPR device or a map of VCSO’s deployed system. People or objects visible in an image are not necessarily identified, indexed or separately searchable. VCSO-specific records are needed to establish video capture, enabled tools and actual search results.
Source: editorial infographic. Compare with the analytical report, report receipts and source status; the artwork is not an agency record or a new calculation.
The lines show possible ways to get access, not completed searches, returned information or verified local connections between vendor platforms. Dated agreements and settings records are needed to check federal, out-of-state and international access. The California-agency label represents an attributed assurance, not a verified inventory of all current or historical sharing.
Source: editorial infographic. Compare with the analytical report, report receipts and source status; the artwork is not an agency record or a new calculation.
Flock Organization and Network Audit Logs and an Axon audit trail were received. “Not provided” means missing accountability detail, not no activity files or proof that a record does not exist. Original presentation and response records are needed to verify the quoted wording and categories.
Source: editorial infographic. Compare with the analytical report, report receipts and source status; the artwork is not an agency record or a new calculation.
These are possible users and connections, not a checked list of who has access now. The 58-agency statement is what VCSO said at a particular time, not the full history of settings or use.
Source: editorial infographic. Compare with the analytical report, report receipts and source status; the artwork is not an agency record or a new calculation.
The measured series counts entries and organization names. The artwork’s reach and network lines are illustrative, not calculations from the daily/monthly datasets. March 2026 is partial.
Source: editorial infographic. Compare with the analytical report, report receipts and source status; the artwork is not an agency record or a new calculation.
The report compares NCRIC across January–July 2024 and August 2024–February 2026. The artwork uses October 2024–March 2026; its ratios (~70% fewer searches, ~3× scope, ~4× networks), camera counts and international access remain unverified. What a search asked to cover is different from what it actually showed.
Source: editorial infographic. Compare with the analytical report, report receipts and source status; the artwork is not an agency record or a new calculation.
This image brings the argument together. The findings remain tied to the records and measurements explained above; the illustrations of access and growth are not additional findings.
Source: editorial infographic. Compare with the analytical report, report receipts and source status; the artwork is not an agency record or a new calculation.
The labels tell you what supports each statement: DOCUMENTED = backed by a record provided or an official source, with the source limits stated; VCSO SAYS = the agency’s account; PLATFORM CAPABILITY = a vendor-described function, not confirmed VCSO deployment; ANALYSIS = a conclusion drawn from the available evidence; UNRESOLVED = the available records leave the question unanswered.