DOCUMENTED
What VCSO’s records show
The local record describes ALPR tests, changes to how long data was kept, and later searches through Fusus Web / ECOM. It shows activity through those services—not every connection the vendor offers.
08 · The Axon Switcheroo
Changing the logo doesn't answer what changed behind it.
CHANGING VENDORS IS NOT PROOF OF LESS SURVEILLANCE.
Replacing Flock could be understood as reducing surveillance concerns—or resolving them altogether. But the name on a camera does not tell residents what happened to the searches, connections, data, or permissions behind it.
THE RECORDS DO NOT SHOW THAT SURVEILLANCE SHRANK.
The local record documents Axon testing, a longer retention setting and later ALPR activity through Fusus Web and ECOM. The central question is what these integration layers bring together—and what limits apply to the resulting system.
A product change can leave old powers in place and make new combinations possible. What actually connects locally? Who can ask the combined system about a person, vehicle or place? What legal process, privacy protections and audit trail govern the answer?
Local audit activity is described in the investigation; original exports are not available here. Vendor capabilities are identified before they are discussed: PLATFORM CAPABILITY ≠ CONFIRMED VCSO DEPLOYMENT.
ANALYSIS
FLOCK → AXON compares vendors. It does not decide how much surveillance Ventura County should allow. The Flock system described in this investigation already included wider-network access, time-and-location searches, plate lookup, vehicle-appearance searches, alerts and sharing.
The meaningful comparison is before and after: what powers ended, what continued and what became possible through a common platform? A camera replacement does not answer those questions.
DOCUMENTED
The local record describes ALPR tests, changes to how long data was kept, and later searches through Fusus Web / ECOM. It shows activity through those services—not every connection the vendor offers.
PLATFORM CAPABILITYNot confirmed VCSO deployment
Fusus can bring together information from multiple sources. Product descriptions tell us what the technology can do. VCSO’s purchasing, settings and activity records are needed to show what it actually used.
The real choice isn't Flock or Axon. It's how large a surveillance network Ventura County wants to build.
Audit entries describe recorded activity. Product pages describe available functions. To compare the actual systems, residents need a dated list of enabled functions and connections, contracts, settings and access logs.
The record does not establish every marketed capability being used locally, Wingtra use outside its stated mission, or cell-site-simulator misuse.

DOCUMENTEDLocal activity described in the investigation
Follow the dates. Staff tested the system, changed how long data stayed, and used more ways to search. Those events need an explanation. When a search ran and how far back it looked are different questions.
The described test looks back approximately 90 days. Which data was available for it, where did it come from and how long was each connected source allowed to keep it?
Which store of data—and which copies—did that setting apply to?
The sequence records tests, not the complete history of later alerts or who approved them.
The activity history records an ALPR search through Fusus Web with this stated purpose. What was compared? What matched? Had Flock actually been shut down? The label alone cannot answer those questions.
Another way to search appears in later entries. We still need records showing how the services connected, who could use them and which data they could reach.
The review describes a search based on the vehicle make the software inferred, limited to an area. How was the make inferred? What limits applied to the search? The activity entry leaves those questions open.
The investigation describes May 2025 testing and the May 20 retention change, followed by Fusus Web / ECOM activity in 2026. The described May 19 lookback, June comparison and July vehicle-make search require the original audit entries for independent verification. Those exports are not available here.
Independent reconciliation requires the underlying entries, exact timestamps, service definitions, retention-setting history, authorization and purpose fields, and the period searched. Chronological proximity does not establish causation. An inferred make is not a verified identity.
PLATFORM CAPABILITYPLATFORM CAPABILITY ≠ CONFIRMED VCSO DEPLOYMENT
Axon describes Fusus combining live video, license-plate information, alerts, dispatch information and other sources. Its product page also markets Axon Air drone feeds for real-time situational awareness and direct evidence transfer to Axon Evidence. These are vendor capabilities, not a verified inventory of VCSO connections.
YOUR DOORBELL DOESN’T HAVE TO BELONG TO THE SHERIFF. Axon describes compatible third-party and community cameras, including owner-controlled live-feed sharing. Listing a camera so investigators can request footage is different from connecting live video.
Which cameras and other sources are actually connected locally? Who opts in, who grants access, under what conditions, and how can access end? The public needs an inventory of what the system can reach, not just what the government owns.
PLATFORM CAPABILITY ≠ CONFIRMED VCSO DEPLOYMENT.
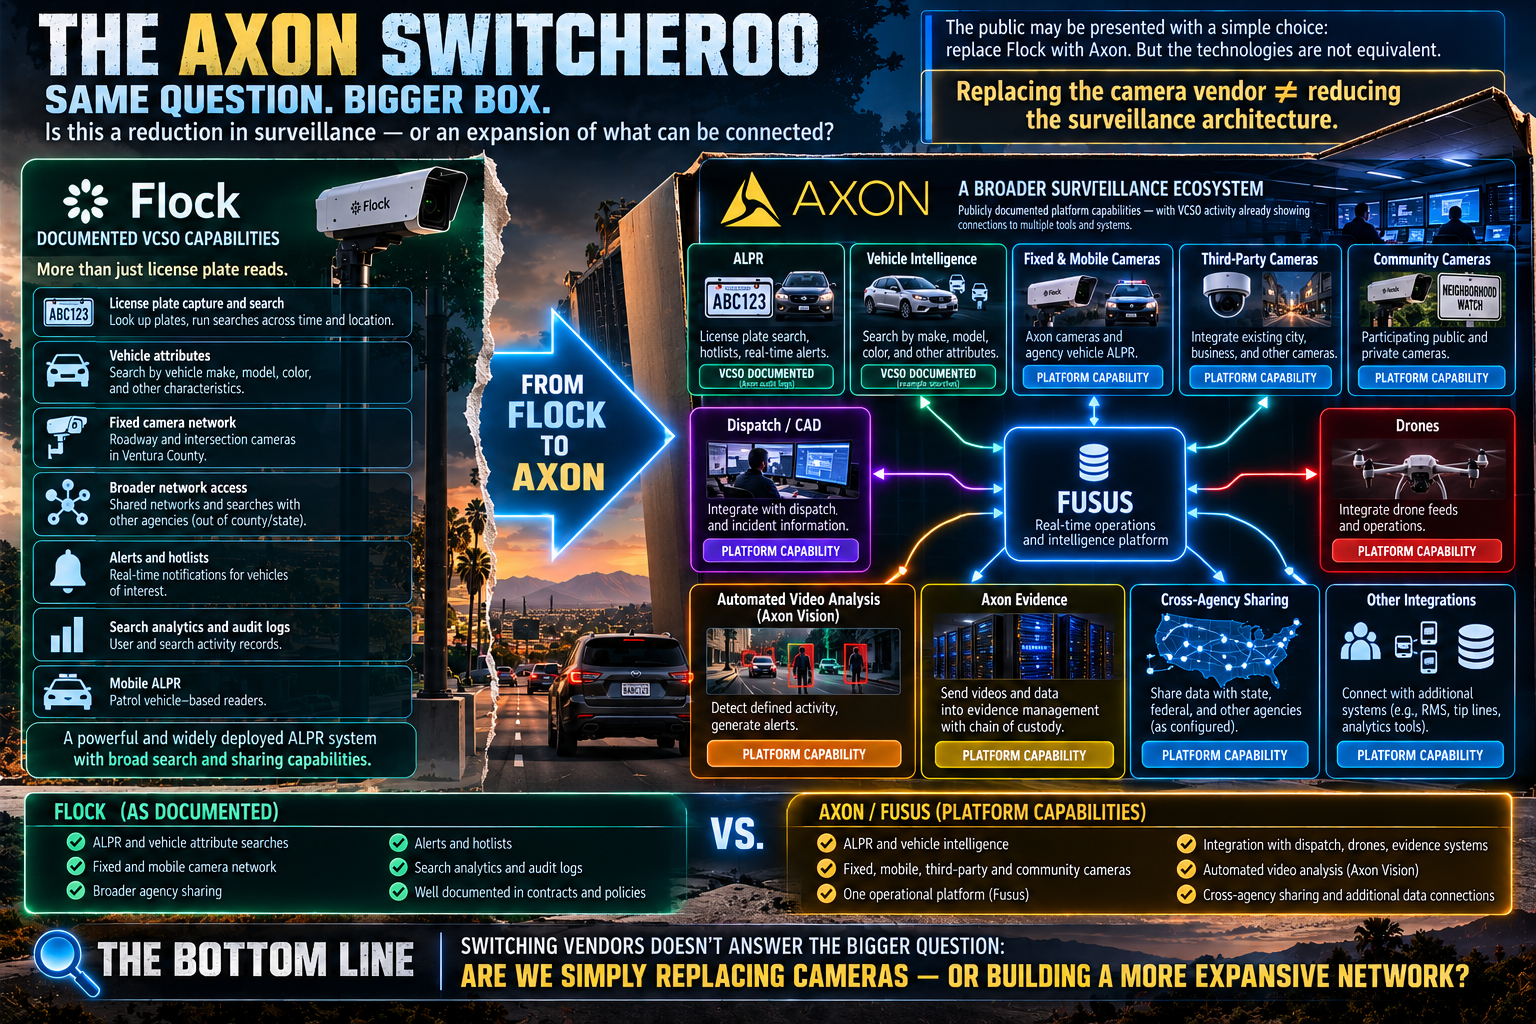
The boxes marked PLATFORM CAPABILITY show products the vendor offers. VCSO’s audit, as described in the investigation, records ALPR activity through Fusus Web and ECOM. Its contracts and settings are needed to check which other tools and connections it bought or turned on.
Open full-resolution original (new tab): THE SWITCHEROO: SAME QUESTION, BIGGER BOXAxon’s community-integration page describes a registry for locating cameras and requesting footage, and CORE integration for compatible camera networks. It describes policy-based sharing controlled by the camera owner. Local participation, configured access, permissions, and revocation still require VCSO-specific records.
PLATFORM CAPABILITYPLATFORM CAPABILITY ≠ CONFIRMED VCSO DEPLOYMENT
Axon says Vision uses software to spot specified activity in connected video and send alerts inside Fusus. Agencies choose the conditions and video feeds; trained people remain responsible for decisions. That describes what the product offers. Records of local use are still needed.
Imagine someone running to catch a bus, pausing outside a closed shop, or helping a friend who has fallen. Ordinary behavior can need context before anyone decides what it means. The accountability question is which defined conditions trigger an alert, how uncertainty is handled, and what a human reviewer sees before acting.
What is turned on, and on which video feeds? How are errors measured and reviewed? Who can change what triggers an alert? What stays in the system after an alert is dismissed? How can the public check that software alerts have not become suspicion nobody can challenge?
Axon describes activity-based detection, human oversight, and agency-controlled settings. It says Vision does not identify individuals, perform facial recognition, or generate behavioral predictions or risk scores. These are vendor descriptions, not independent verification of a local implementation. Ask for any VCSO contract, configuration, evaluation, training, and audit records before claiming deployment.
PLATFORM CAPABILITYPLATFORM CAPABILITY ≠ CONFIRMED VCSO DEPLOYMENT
Axon markets Fusus as a common operational environment for previously separate sources. Other third-party integration layers raise the same question: what can one user now assemble without moving between separately governed systems?
Integration can erode practical boundaries: separate interfaces, owners, permissions and procedures once made different information harder to combine. This is not evidence that Fusus bypasses due process at VCSO. It is a reason to ask which legal and operational boundaries remain effective when sources are connected.
The county should show configuration records, contracts, integration inventories and audit logs: who can access each source, when a warrant or other legal process is required, how source-specific restrictions follow the data, what can be retained or shared, and how improper use is detected. Due process, civil rights and privacy must be accounted for across the combined system—not left between vendors.
Think about an ordinary day: work, a doctor’s visit, lunch, walking the dog, home. Combining sightings can suggest a story about your life without explaining why you were there. The system must be accountable for that inference as well as the individual records.
PLATFORM CAPABILITY ≠ CONFIRMED VCSO DEPLOYMENT. THIS IS NOT A LOCAL SYSTEM MAP.
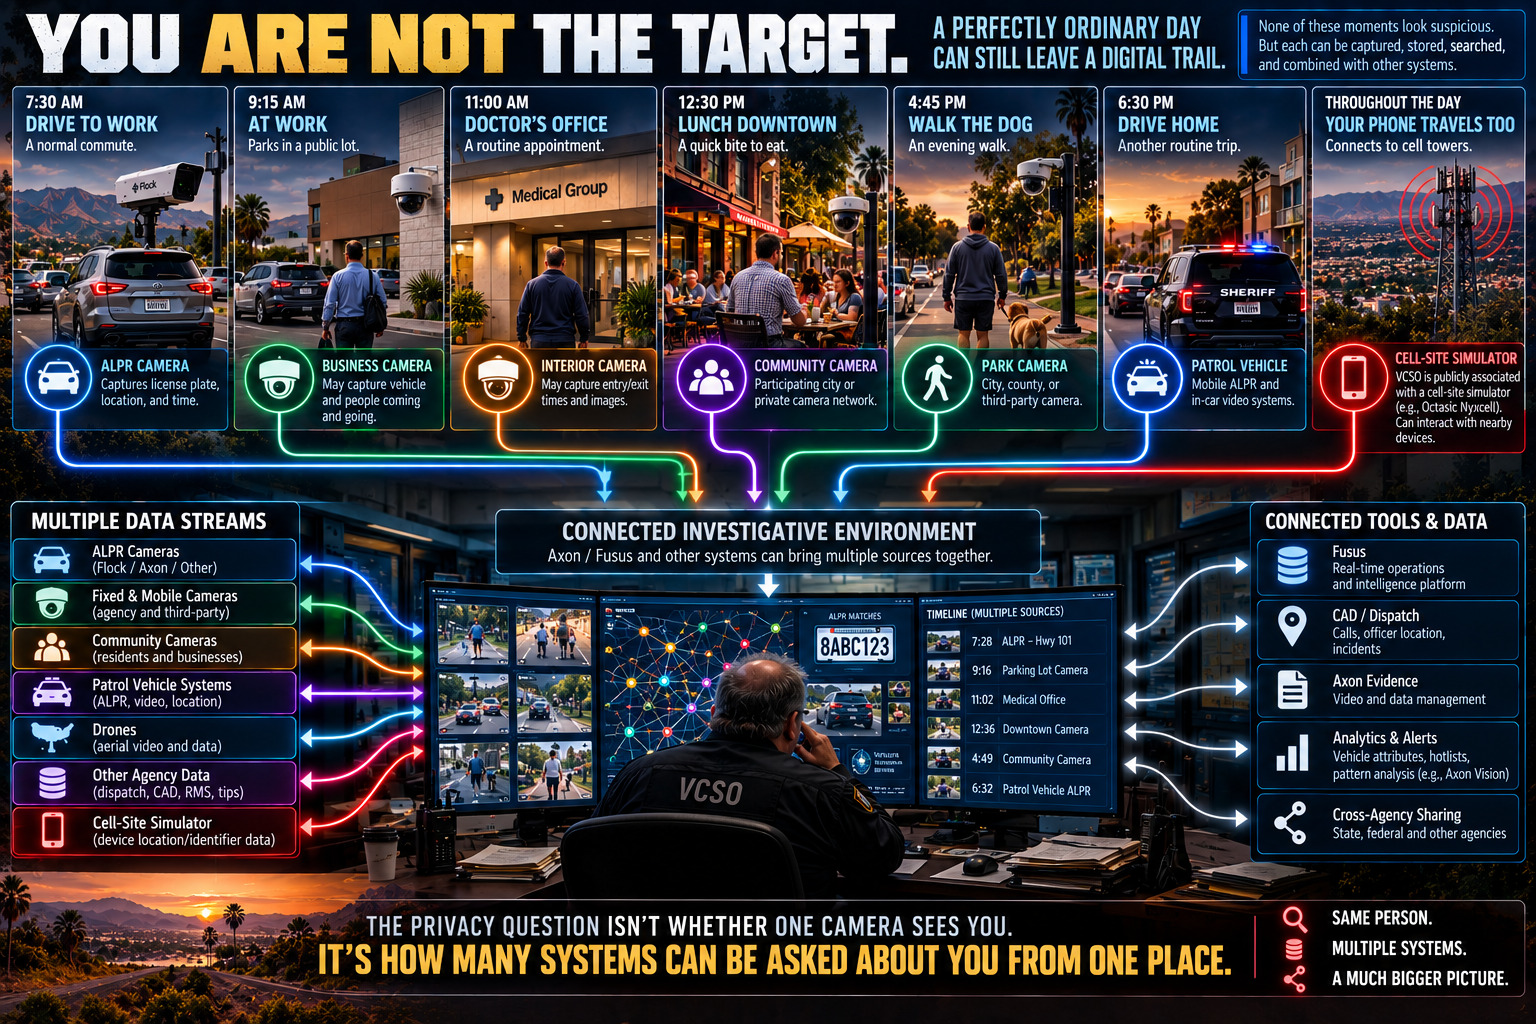
What combined surveillance could mean in an ordinary life—not a record of someone being tracked. The cell-site-simulator purchase and connection are unverified; the graphic cannot establish either.
Open full-resolution original (new tab): YOU ARE NOT THE TARGETThe privacy question isn't whether one camera sees you. It's how many systems can be asked about you from one place.
This is a conceptual account of information being combined. It is not a claim that all pictured sources reach VCSO’s Fusus environment, that every moment is recorded, or that a particular person was tracked. The phone / cell-site-simulator element is a separate receipt-pending issue, not a verified Fusus integration.
ANALYSISAn imagined example of the privacy stakes—not a reported incident
Imagine an ordinary silver Toyota. You drive to work, visit a doctor and stop for lunch. If investigators search by a vehicle’s color, make, type or other visible features within a chosen area and period, your car could be one of many innocent matches. The search could begin without an exact plate number.
Who may approve that search? How large an area can it cover, and how far back can it look? How sure was the software about the vehicle’s make? How are innocent matches ruled out? What reason must the user record? Can someone later piece together exactly what was searched?
Produce the search authority, geographic boundary, lookback period, attribute and confidence criteria, treatment of uncertain or innocent matches, and field-preserving audit trail. A matching vehicle description is not proof of the driver’s identity, intent, or wrongdoing.
UNRESOLVEDVendor-described transfers; actual VCSO destinations remain unverified
Axon says video linked to an incident and other information can move into Axon Evidence. Once systems connect, a statement that data is deleted after 365 days needs a more precise answer: which copy?
Deleted from the original ALPR system? From Fusus? From a downloaded file, Axon Evidence, an investigative file, another agency’s system, a backup or information the software created? Show which copies actually exist and what happens to each.
Produce a map of where the data goes after capture. Name every actual destination, how long each copy stays, who can approve exceptions, who can download or share it, and how VCSO checks that copies elsewhere were deleted.
For each actual flow, document the source, destination, data fields, access controls, retention trigger, legal hold or exception, deletion method, downstream obligations, and audit evidence. A source database’s retention setting cannot independently prove that an export or derived record has been deleted.
VCSO SAYSWingtra RAY: the publicly stated search-and-rescue mission
A fixed camera observes where it is installed. Mobile aerial sensors can observe elsewhere. VCSO documents an aerial program and describes Wingtra RAY—a fixed-wing drone that takes off and lands vertically—as used exclusively to locate vulnerable lost or missing people.
PLATFORM CAPABILITY ≠ CONFIRMED VCSO DEPLOYMENT. Axon markets live drone-feed integration through Fusus. VCSO drone ownership plus Axon’s marketing does not prove those drones are integrated into Fusus.
When a common platform can combine cameras, plate data, alerts and live aerial/video feeds, accountability shifts to what the whole system can assemble—and who can ask it to. Show the actual local connections, sensors, approved uses, access, retention and audit records. Preserve Wingtra’s stated mission as a separate limit, not a claim about the entire fleet.
DOCUMENTED
The annual report accounts for the overall aerial program, its uses, costs and planned purchases. It records January 13, 2026 Board approval to purchase two DJI Matrice 4E aircraft for Emergency Services, with possession expected during 2026—not proof of delivery or a platform connection.
PLATFORM CAPABILITYNot confirmed VCSO deployment
Axon’s Fusus page markets integrated drone feeds for real-time response. Which VCSO aircraft or feeds, if any, enter that environment remains a local-records question.
The official announcement calls Wingtra RAY a search-and-rescue tool “used exclusively to locate vulnerable lost or missing persons.” Keep that agency statement distinct from independent operational verification. Wingtra RAY is a drone; it is not cell-site-simulator technology.
DOCUMENTED — Annual report, printed page 2 (PDF page 3), reports 27 UAVs (unmanned aerial vehicles) and 687 events across the overall program—not Wingtra RAY. Category names follow the report; Tactical Team includes SWAT and TRT. It also records approximately $14,466 approved for two DJI Matrice 4E aircraft for Emergency Services, with possession expected in 2026.
The 70 “Homeless related operations” and 81 Organized Retail Theft events remain questions about approved uses, retention and data destinations. The report does not establish a Flock, Axon or Fusus connection. Neither the annual report nor the Wingtra mission statement establishes a local thermal, night-sensing or LiDAR integration.
UNRESOLVEDPurchase and integration remain unverified
The Nyxcell / cell-site-simulator claim associated with the conceptual graphic is unverified. A cell-site simulator imitates a cell tower; it is not Wingtra or camera technology. Neither the purchase nor a Fusus connection is established by the records available here.
The purchase and its price still need the County’s own records. What was bought, for what approved purpose, under which policy? Who must approve its use? How long can it keep data, and who independently checks that the rules are followed?
The graphic is not a procurement receipt. Neither an independently checked secondary publication nor the County’s primary purchasing record is available here. It does not establish deployment, operational use or integration.
ANALYSISA comparison of reporting rules—not a finding of a legal violation
Ventura County already documents major equipment through contracts, purchasing decisions and mandated inventory reports. The Civic Review Packet summarizes the Flock contract; VCSO’s annual equipment report identifies hardware, costs, funding, uses and planned acquisitions. The underlying contract is still needed to independently check the summary.
The annual report describes Ordinance 4603 / AB 481 requirements for covered equipment: Board submission, public posting, a community meeting, use and purpose, complaints, audit findings, corrections, costs, quantities and future purchases.
The accountability gap is system architecture: what connects to what, which functions are enabled, who has access, what legal process applies, how long each copy stays, and whether the audit trail can detect abuse. A hardware inventory does not answer those questions.
ANALYSIS — This compares governance models. It does not establish that ALPR or Axon is legally covered by AB 481, or that VCSO violated a reporting requirement.
| DOCUMENTEDMilitary-equipment report accounts for | UNRESOLVEDConnected-surveillance questions |
|---|---|
| InventoryQuantities possessed for each covered equipment type. | What can the system do? Which connections are turned on or off? |
| Use / purposeHow covered equipment was used and why. | Which uses are approved? Where are training records and the dated history of settings changes? |
| Costs / fundingAnnual costs for each type and the funding source. | What does the connected system cost? Who pays, and what ongoing commitments come with it? |
| Complaints / concernsA summary of complaints and concerns received. | How can residents raise concerns across connected systems, and how are those concerns resolved? |
| Audit / policy findingsInternal-audit results, policy violations and actions taken. | Where are audit results and records showing where copies go, how long each stays and whether the connected systems follow the rules? |
| Future acquisitionsIntended additional acquisitions and quantities. | What future expansion is planned, and what became of decommissioned Flock components? |
WE CAN INVENTORY THE HARDWARE. WHY CAN’T WE INVENTORY THE SYSTEM?
DOCUMENTED — The report is dated April 22, 2026 and covers January 1–December 31, 2025. Printed page 1 (PDF page 2) sets out the six annual reporting categories, website-posting requirement and community-engagement requirement. Those requirements concern equipment covered by Ordinance 4603 / AB 481; this comparison does not establish ALPR/Axon coverage.
UNRESOLVED — Printed page 5 (PDF page 6) reports approximately $15,229 from the existing FY 25/26 budget for “network video upgrades, enhanced recorders and associated equipment.” This appears under tracked armored vehicle / ROOK equipment costs, not as an ALPR procurement line. What equipment, vendor, configuration and retention rules did that expenditure cover?
The report does not establish any relationship between that $15,229 expenditure and ALPR, Axon or Fusus. It is a follow-up lead only, not evidence of a surveillance integration or misconduct.
UNRESOLVED
Residents should not have to reconstruct a policy decision from product pages and scattered audit entries. The choice to connect sources should leave a decision file: alternatives, approved limits, responsible officials, contracts, settings, training and meaningful audits.
We can inventory major equipment. The public still needs the architecture and the decisions behind the connected system.
Produce dated decision records, options evaluated, approved limits, accountable decision-makers, configuration changes, decommission evidence, training documentation, and audits. A missing receipt in the produced package is not proof that the underlying record never existed. Redactions should protect legitimate interests without making the governing decision impossible to verify.
The missing training receipts leave the assurance unverified; they do not establish that employees were untrained.
UNRESOLVED
Show the before-and-after record: cameras removed, accounts closed, connections and sharing revoked, historical data deleted or moved, functions retained or replaced. A canceled contract and a different logo are not proof of a smaller system.
DOCUMENTED
VCSO’s 2025 annual report says its unmanned-ground-vehicle inventory declined from eight robots reported in 2024 to six. It explains that obsolete or damaged robots were returned or destroyed because they were no longer serviceable. Source: printed page 2 (PDF page 3).
ANALYSIS
When VCSO retired covered equipment, it recorded the inventory change and explained what happened to it. Residents should be able to get that same basic account of retired surveillance equipment, access and data.
If Flock disappears from the roadside while its function is absorbed into a larger connected surveillance environment, that isn't necessarily less surveillance. It may just be surveillance with a different logo.
Publish a before-and-after capability matrix, camera and account inventories, revoked network and sharing relationships, integration shutdown records, historical-data disposition, and dated tests showing which access paths no longer work. Identify what continues under the replacement system and the authority for keeping it.
Judge the transition by what actually connects, what powers remain and what safeguards can be independently tested. Integration is not inherently proof of misconduct; neither is a new vendor proof of restraint.
The county should produce the system map, contracts, enabled-function inventory, permissions, legal-process rules, data-retention map and audits capable of detecting abuse. Those records belong beside—not behind—the hardware inventory.
ANALYSISWhat officials should require
Apply the county’s existing documentation discipline to the architecture, not just the gear. Explain who can combine which sources, under what authority, and how review detects personal misuse, improper access, settings failures and retained copies. “No abuse discovered” is meaningful only when the detection process is visible.
This asks officials to extend that public reporting model. Whether AB 481 already covers ALPR is a separate legal question.
HARDWARE, CONNECTIONS, AUTHORITY, ACCESS, RETENTION, AUDITS. ACCOUNT FOR THE WHOLE SYSTEM.
DON’T SELL US A NEW LOGO. SHOW US THE SYSTEM — AND SHOW US IT ISN’T BEING ABUSED.
NEXT — 09 / REAL-WORLD CASES: PEOPLE, ACCESS AND SYSTEM SETTINGS.
Supporting Materials
Check the work for yourself. The report, methods, legal sources, charts and details about the data are here when you want them.
Available materials vs. originals. Included here: charts, data files, the Civic Review Packet and collected legal sources prepared for this review. The packet explains specific findings page by page. The original Flock/Axon audit files, Camarillo presentation and records-request correspondence are not included.
Praeva Analytics ALPR Audit Records Civic Review Packet · 33 pages · September 2026
Read the complete report alongside its charts. This packet contains the analysis prepared for the review, not the agency’s original audit files, response letters or presentation.
Read the report (PDF)Download the reportPage-specific report receipts
Source notes record verification against official California Legislative Information on October 4, 2026:
Project-produced-source cross-checks:
A duty to maintain records or adopt a policy, a duty to disclose records under the California Public Records Act (CPRA), and evidence of actual compliance are three different questions.
Original materials referenced by the investigation but not available here include the redacted Axon audit trail, records-request and deficiency correspondence, and Moorpark City Manager correspondence. Public receipts must protect requester-identifying information.
The original report graphics are all here, with their labels, explanations, sources and full-size views. The image index below also includes the deeper analysis.
ANALYSISMatching organization names to likely states
The examined profile contains 53,277 Texas-associated entries, 26,810 Florida-associated entries, 20,275 Ohio-associated entries and 47,312 Georgia-associated entries. States are assigned from the organization names in the files. The separate organization profile adds frequency, persistence and requested-window context.
The daily evidence identifies an aggregate other-state surge. The state map compares audit-label populations by candidate-associated geography.
Verifying each state’s trend over time requires the underlying name-to-state classifications and dated entries, using the same periods and totals as the report.
The original map remains intact as an analytical receipt. The controlled supplemental profile includes 20,275 Ohio-associated audit observation rows.
Source status and remaining receipts. The totals are transcribed from the report, not independently recalculated from original exports.
Original state map · Organization profile · Original supplemental device-hours analysis (new tab) · Return to Chapter 03
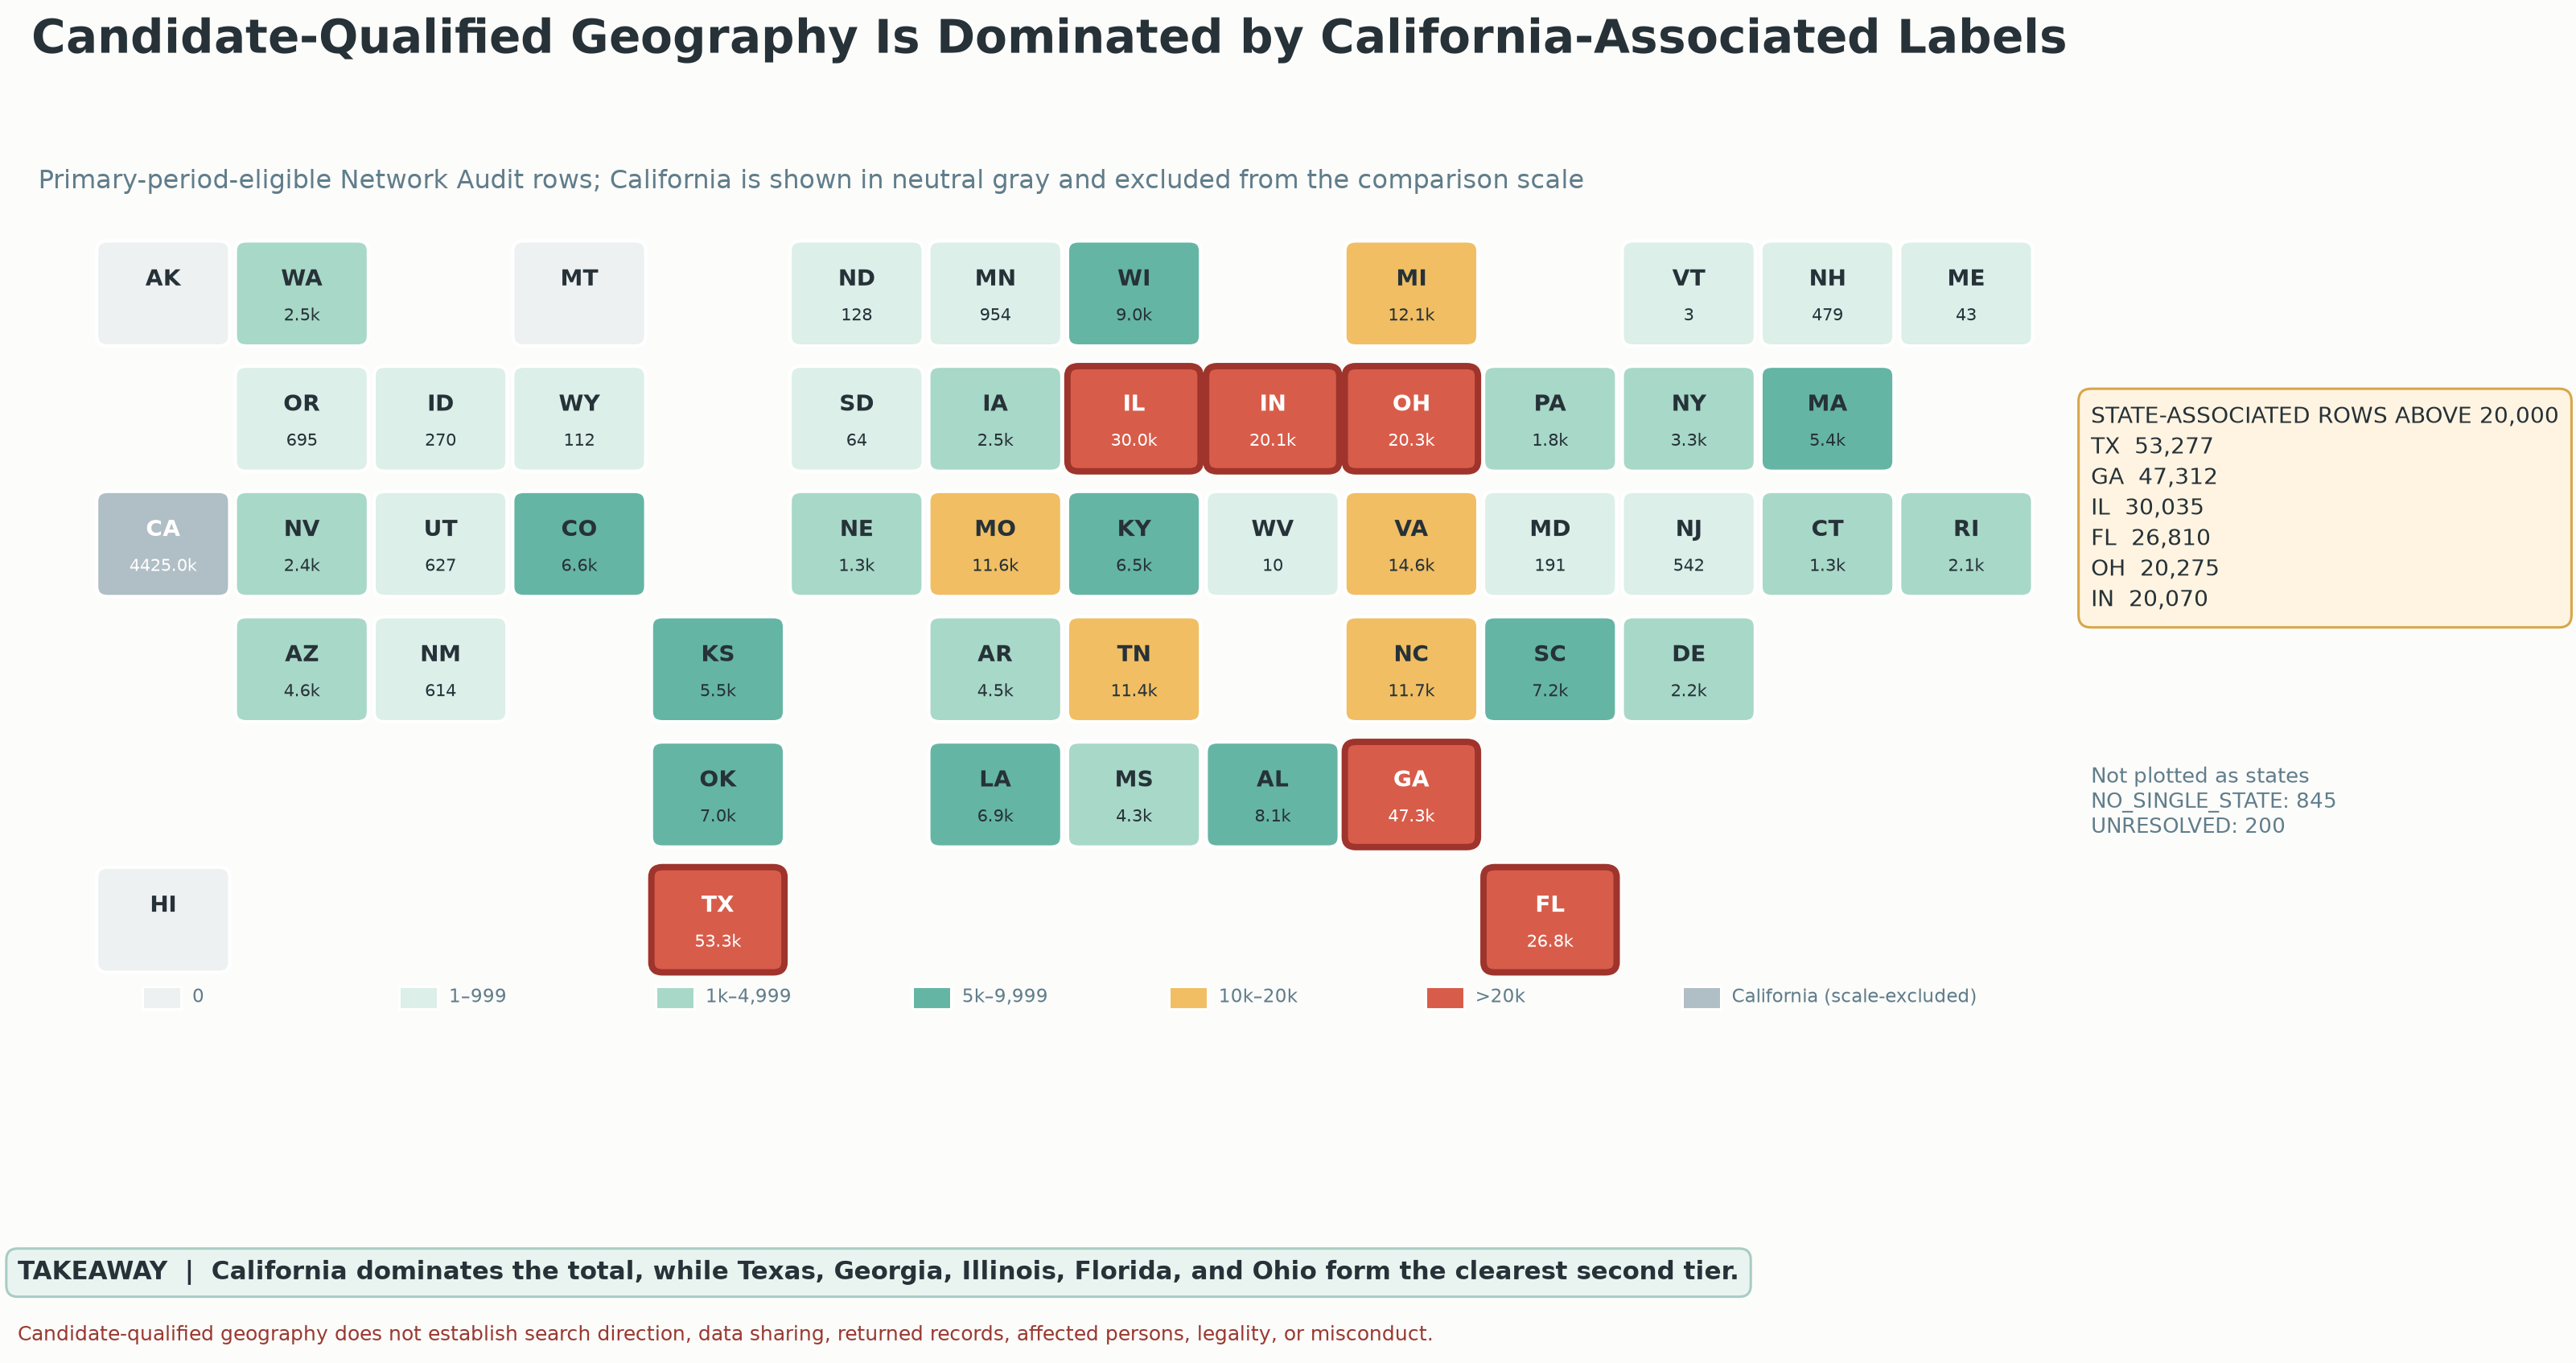
This original map classifies primary-period-eligible Network Audit rows by candidate-associated state. It compares populations rather than trends over time. The February–March surge appears separately in the daily-regime graphic. Unknown or multi-state labels remain separate.
Source: Praeva Analytics candidate-state map; totals are transcribed from the analytical report, not independently recalculated. Original name-to-state classifications and dated state-level tables are not available here.
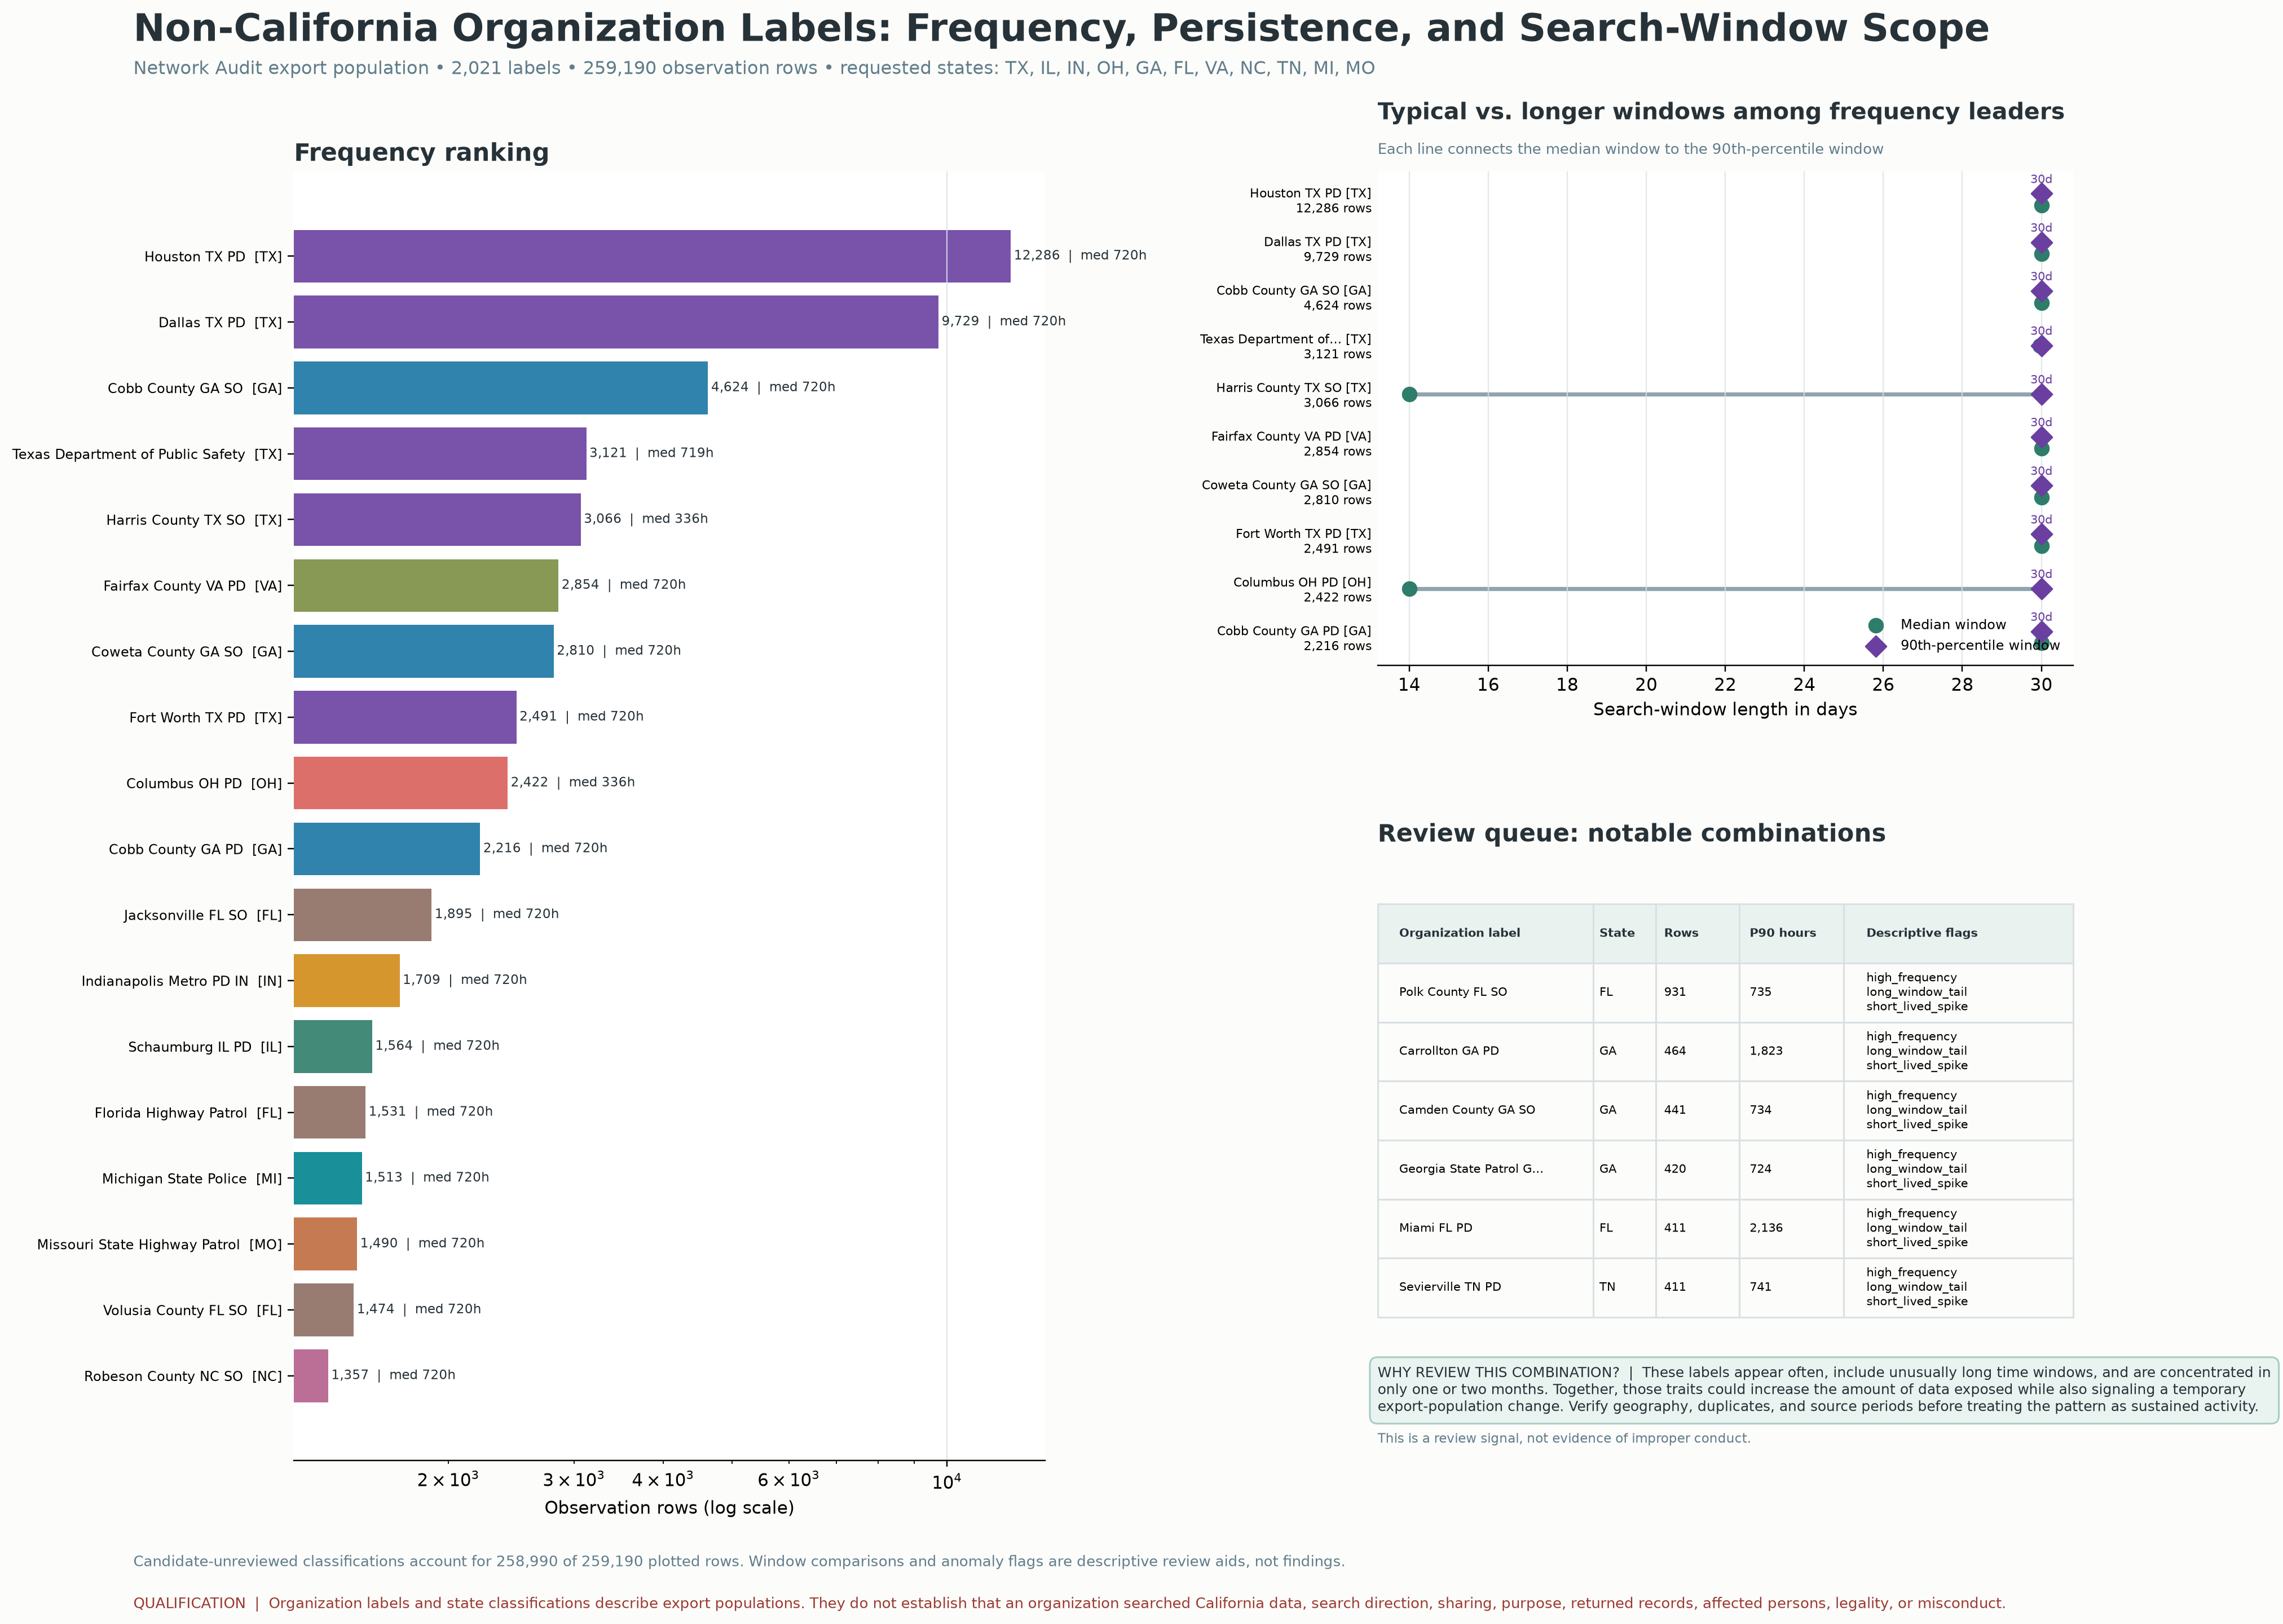
The graphic compares export rows, observed persistence and requested time windows for a selected non-California label population. The controlled supplemental profile includes 20,275 Ohio-associated audit observation rows. Review flags identify labels for further examination.
Source: Praeva Analytics organization profile; Civic Review Packet pp. 6–7 explains the screening approach. Underlying classification and query-level tables are not available here.
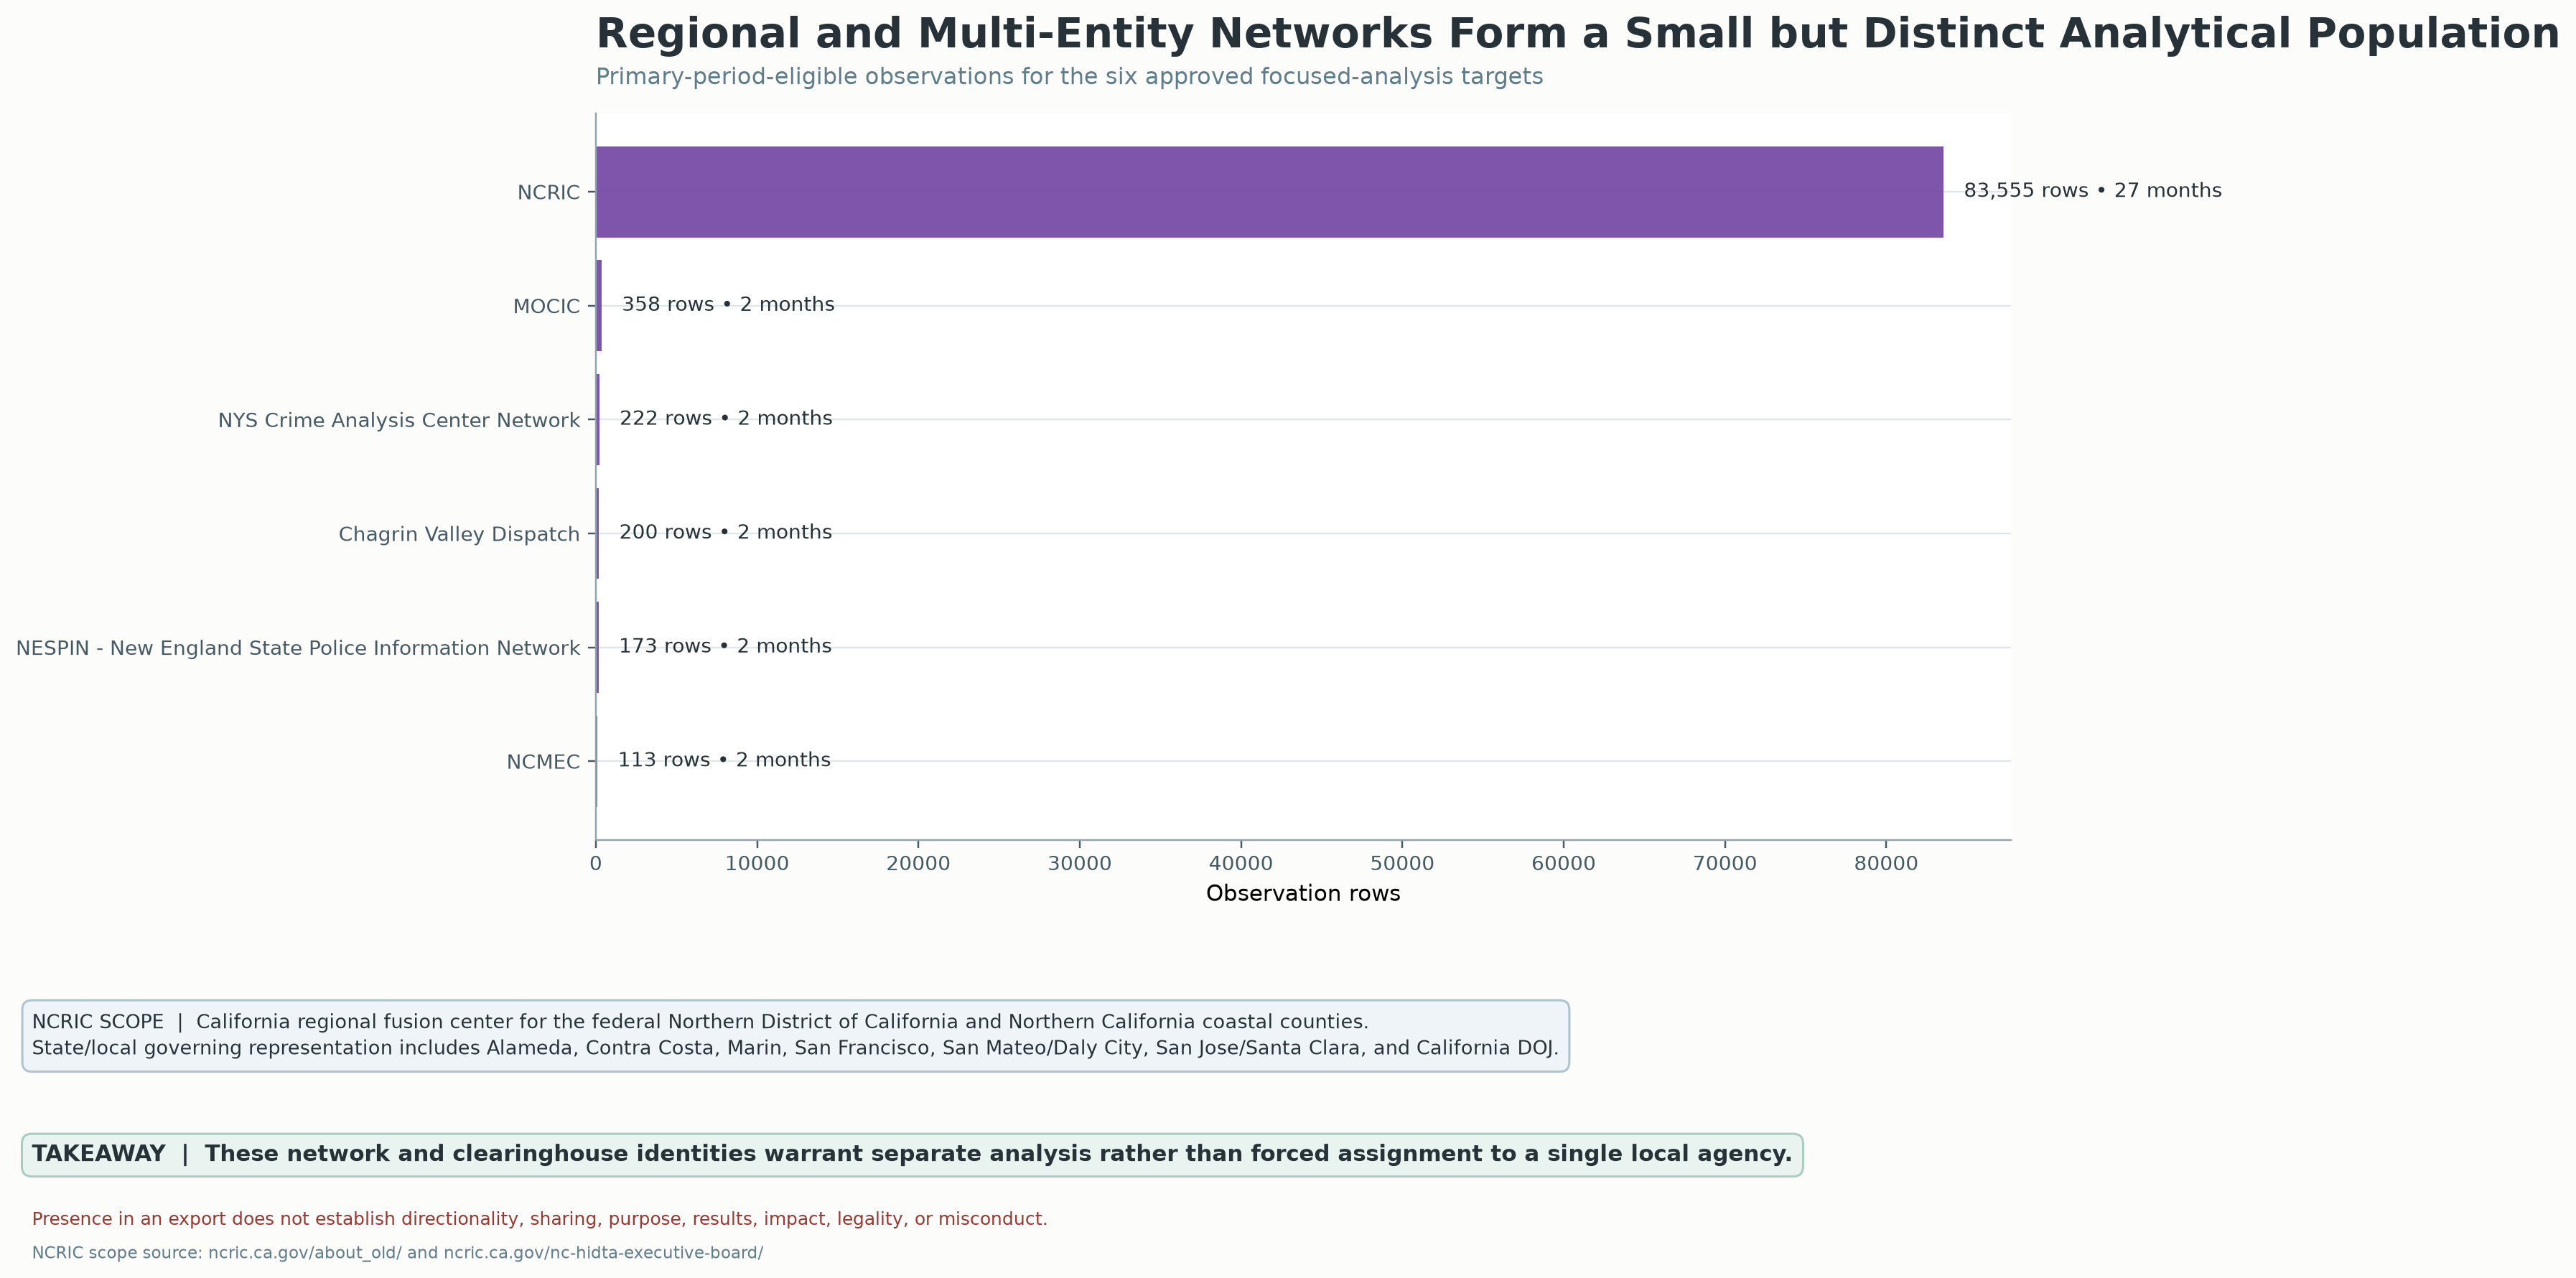
The graphic describes NCRIC as a California regional fusion center serving the federal Northern District and Northern California coastal counties. It cites NCRIC scope and governance pages. The comparison uses entries in the report’s eligible period for six selected networks.
Source: Praeva Analytics regional-network graphic; scope references: ncric.ca.gov/about_old/ and ncric.ca.gov/ncric-hidta-executive-board/. Underlying network export is not available here.
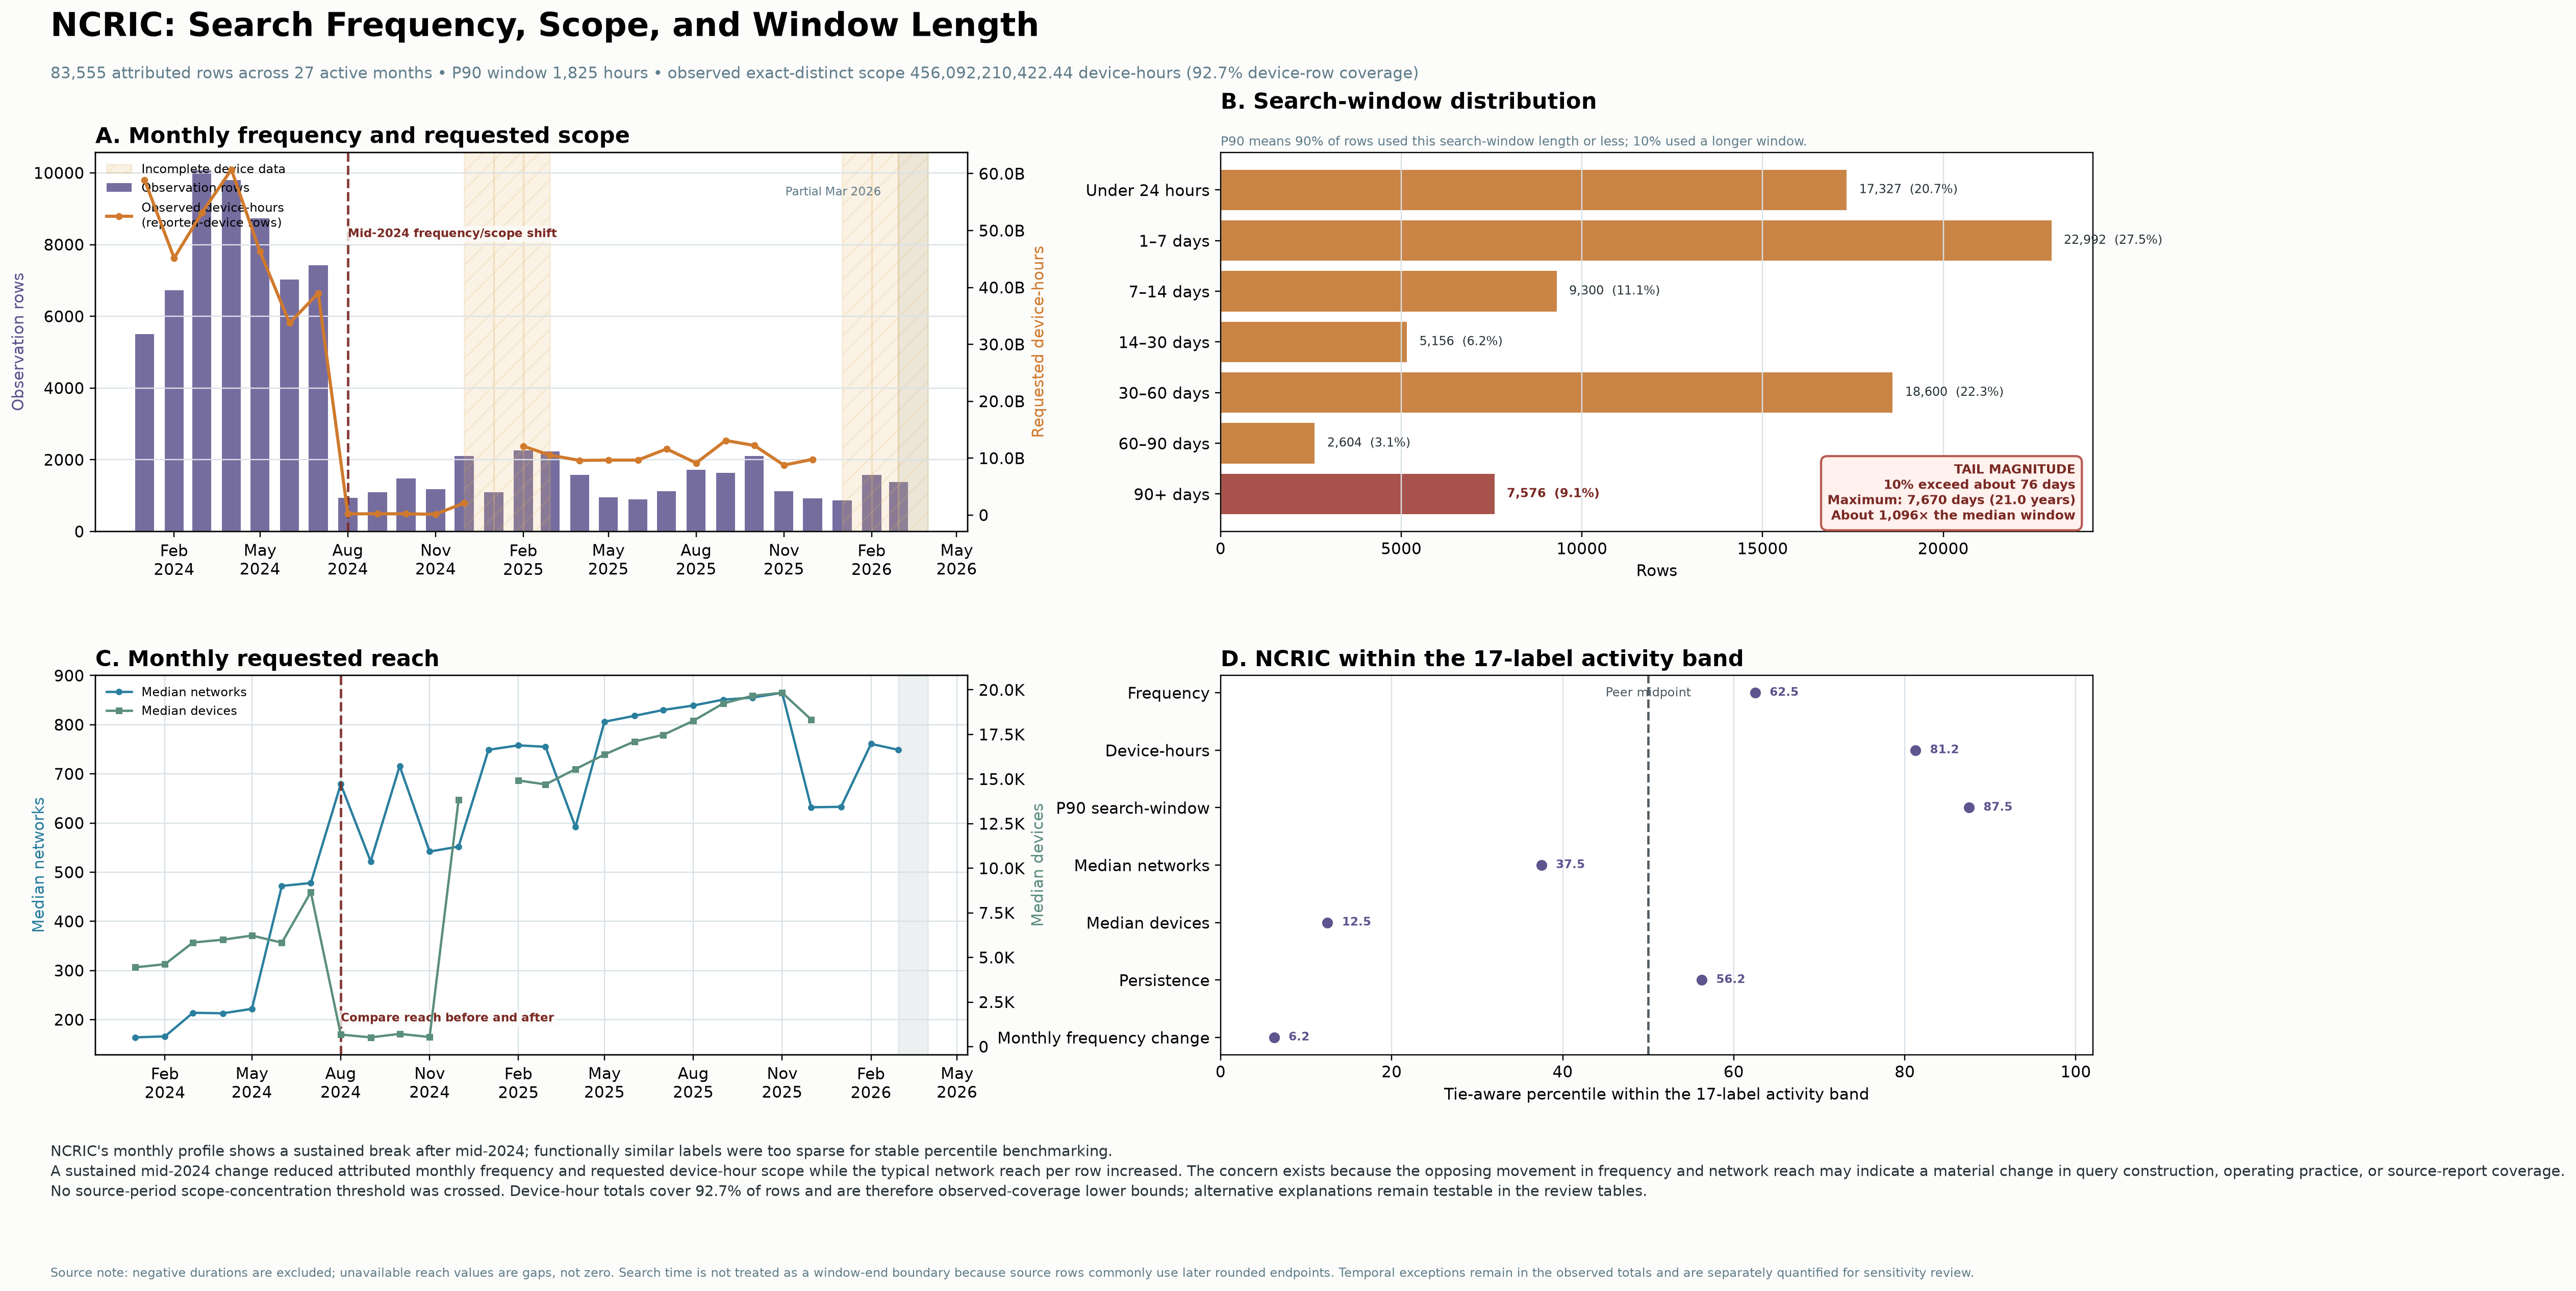
Monthly attributed rows, requested scope, requested windows and activity-band comparisons describe different dimensions. The graphic warns against treating the source-period scope concentration threshold as constant. Device-hour coverage is incomplete; time ranges represent requested windows. The profile identifies review questions about query construction, practice and export coverage.
Source: Praeva Analytics NCRIC profile; Civic Review Packet pp. 24–25 explains the mid-2024 change and possible source/reporting explanations. Query-level data and original export are not available here.
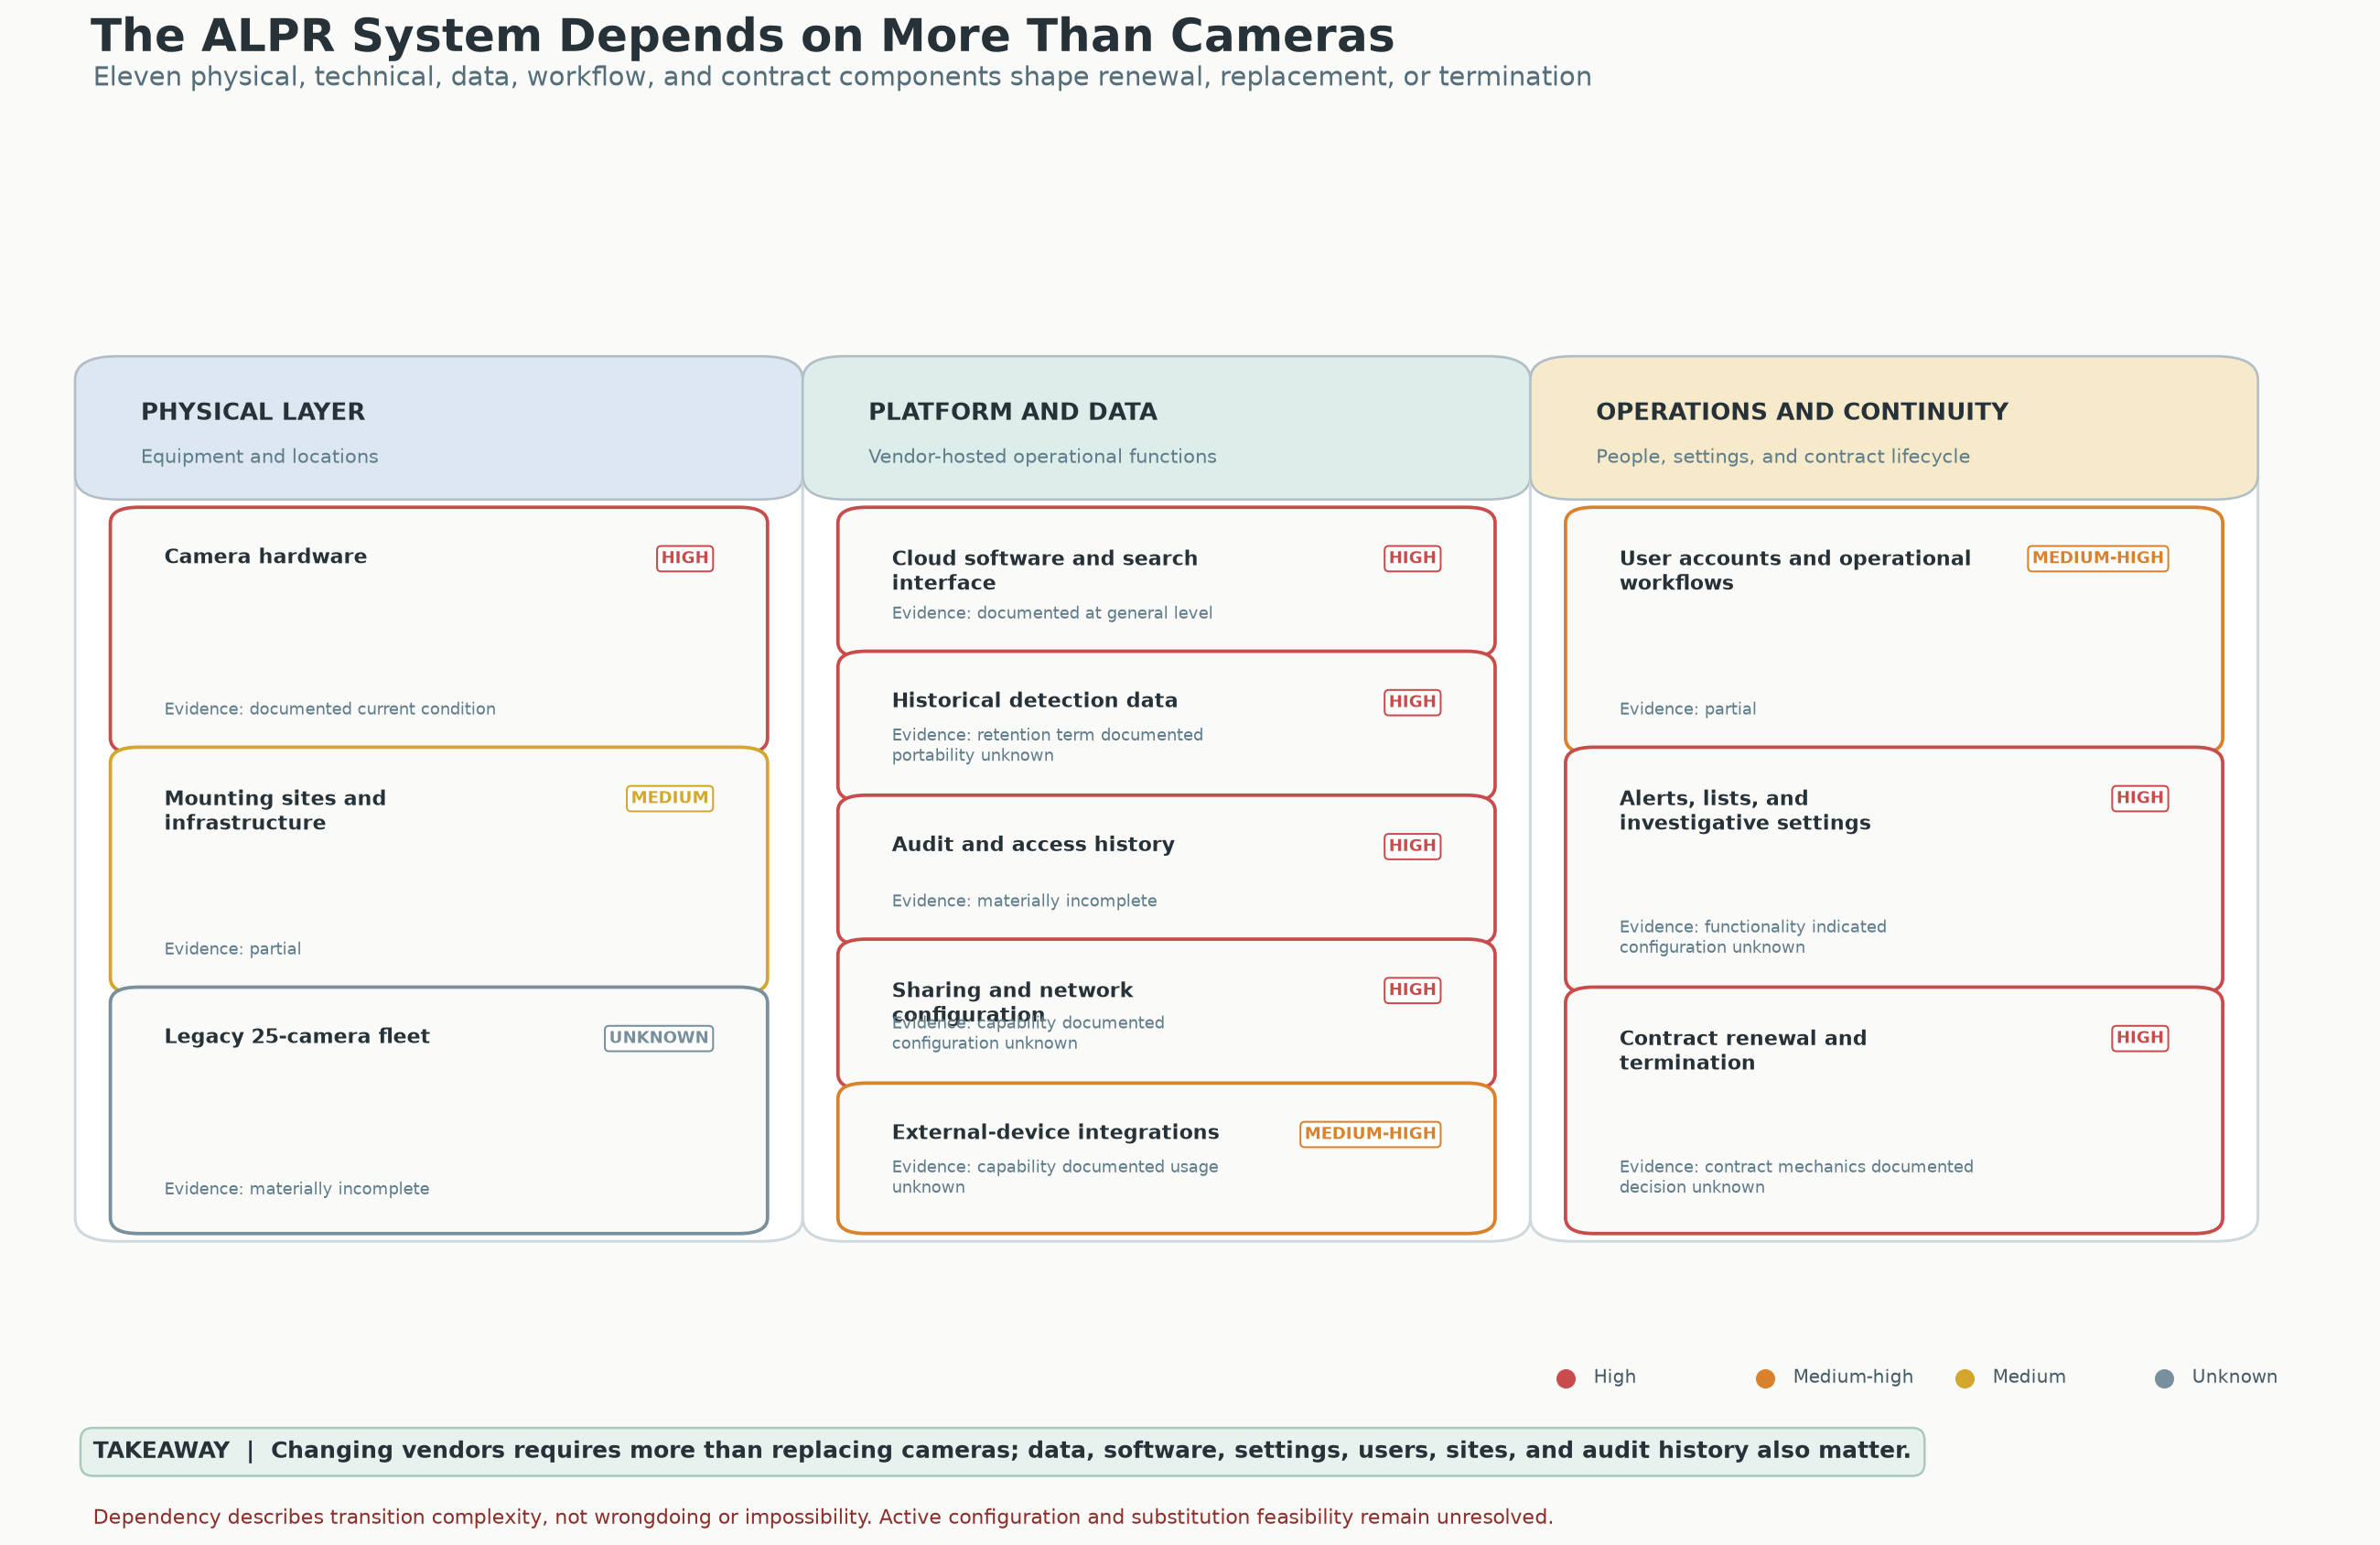
The original graphic maps dependencies across the physical layer, platform/data, and operations. Its ratings describe transition complexity. Active configuration and substitution feasibility require further records.
Source: Praeva Analytics capability-dependency graphic accompanying the analytical report.
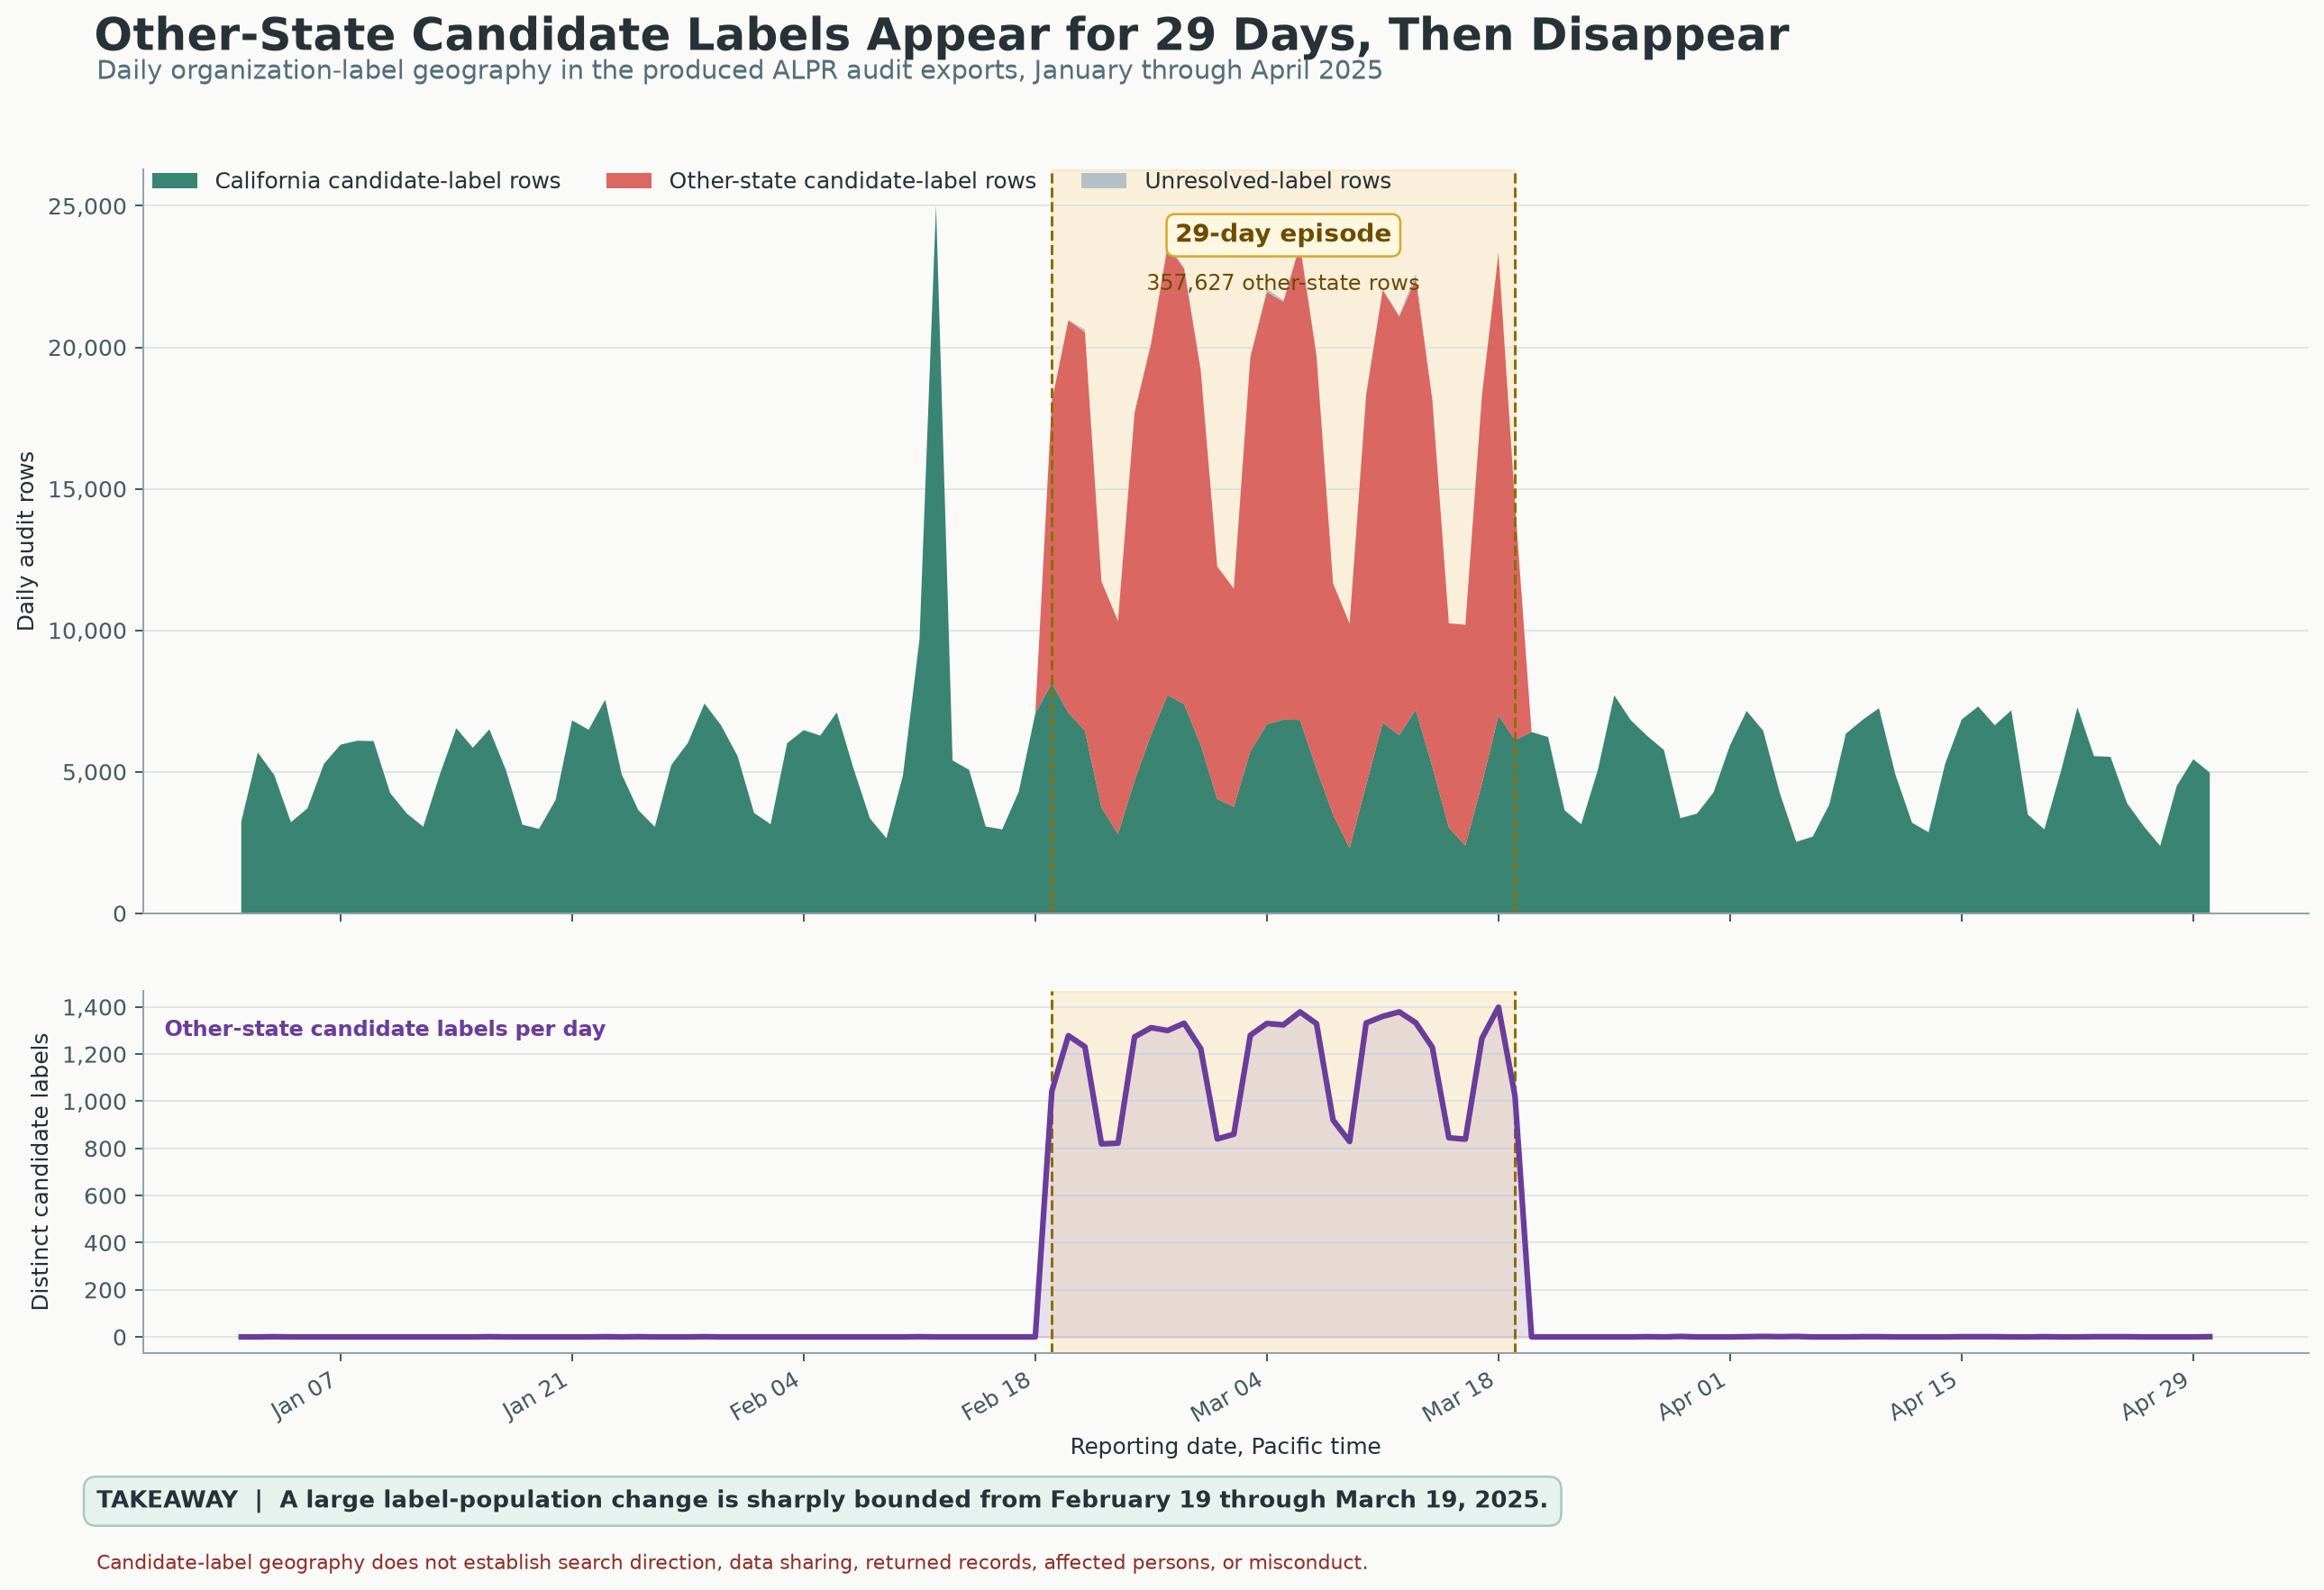
The upper panel shows daily audit rows; the lower panel shows distinct other-state candidate labels. Both identify the same bounded interval.
Source: Praeva Analytics daily graphic; Flock exports analyzed in daily_regime.json.
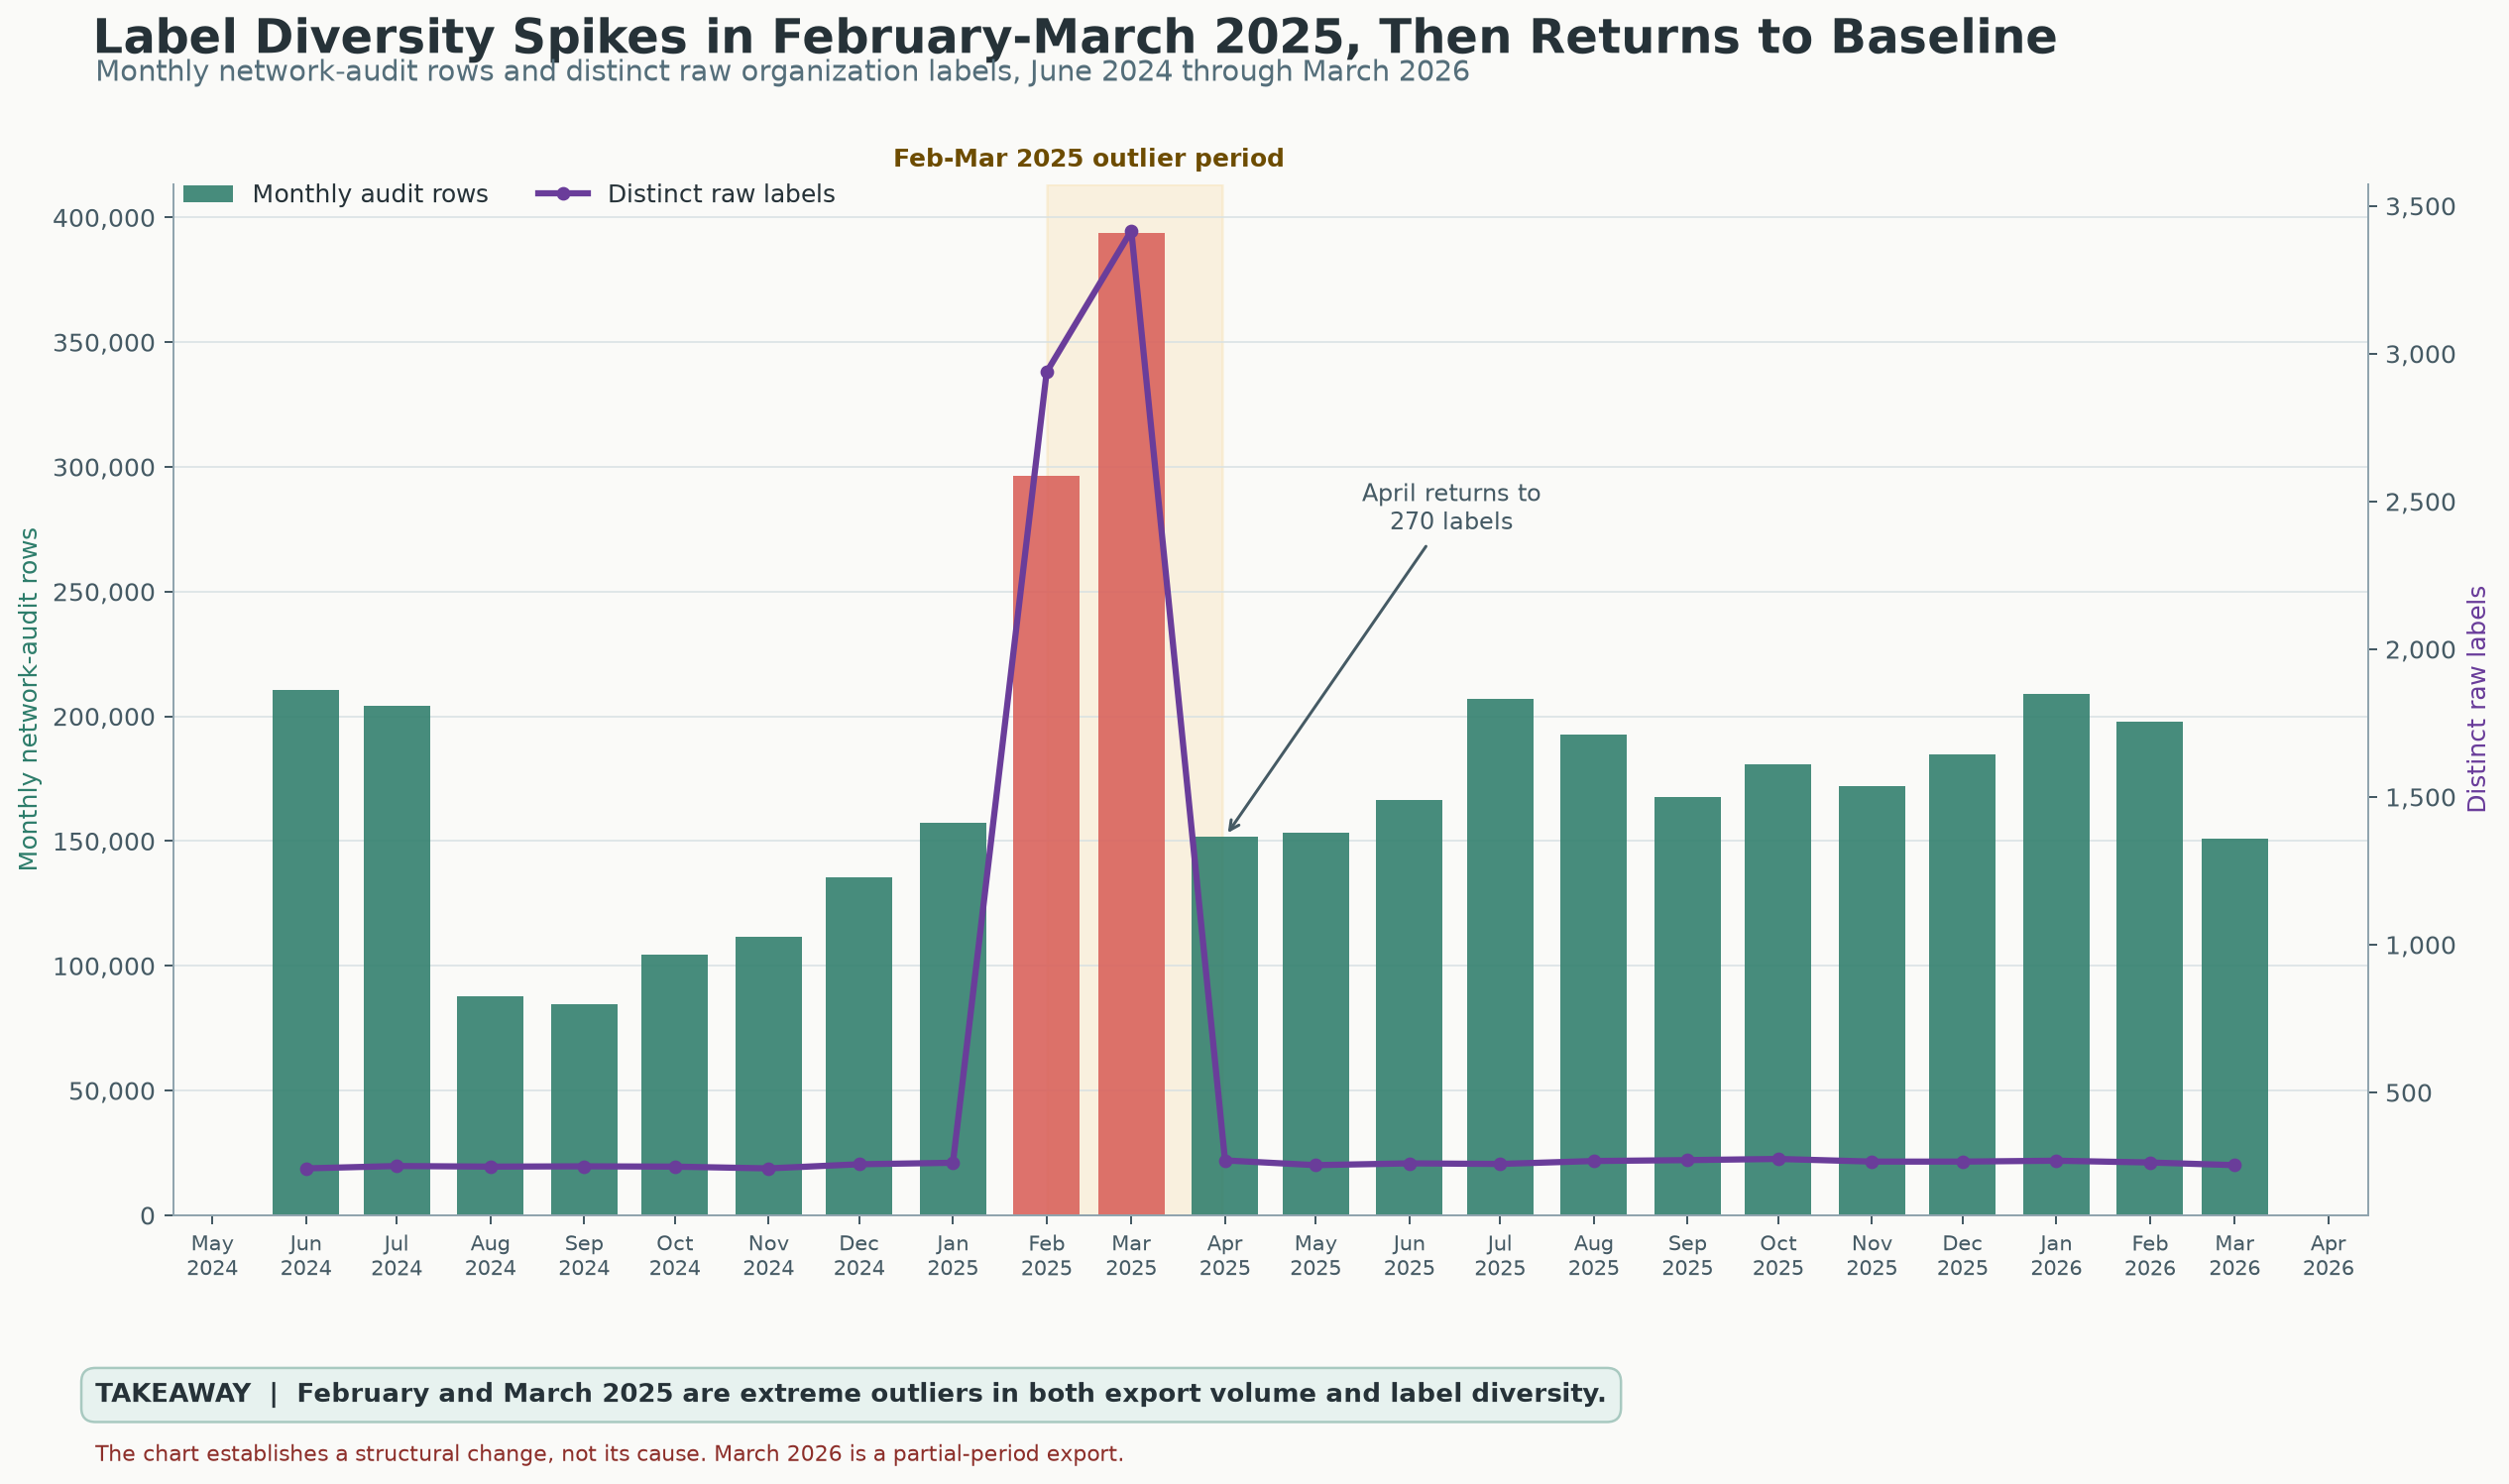
Bars count monthly network-audit rows; the line counts distinct raw organization labels. These are exported populations, not verified people, searches, recipients or search direction. The chart establishes structural change, not cause. March 2026 is a partial-period export.
Source: Praeva Analytics monthly graphic and monthly_network.json.
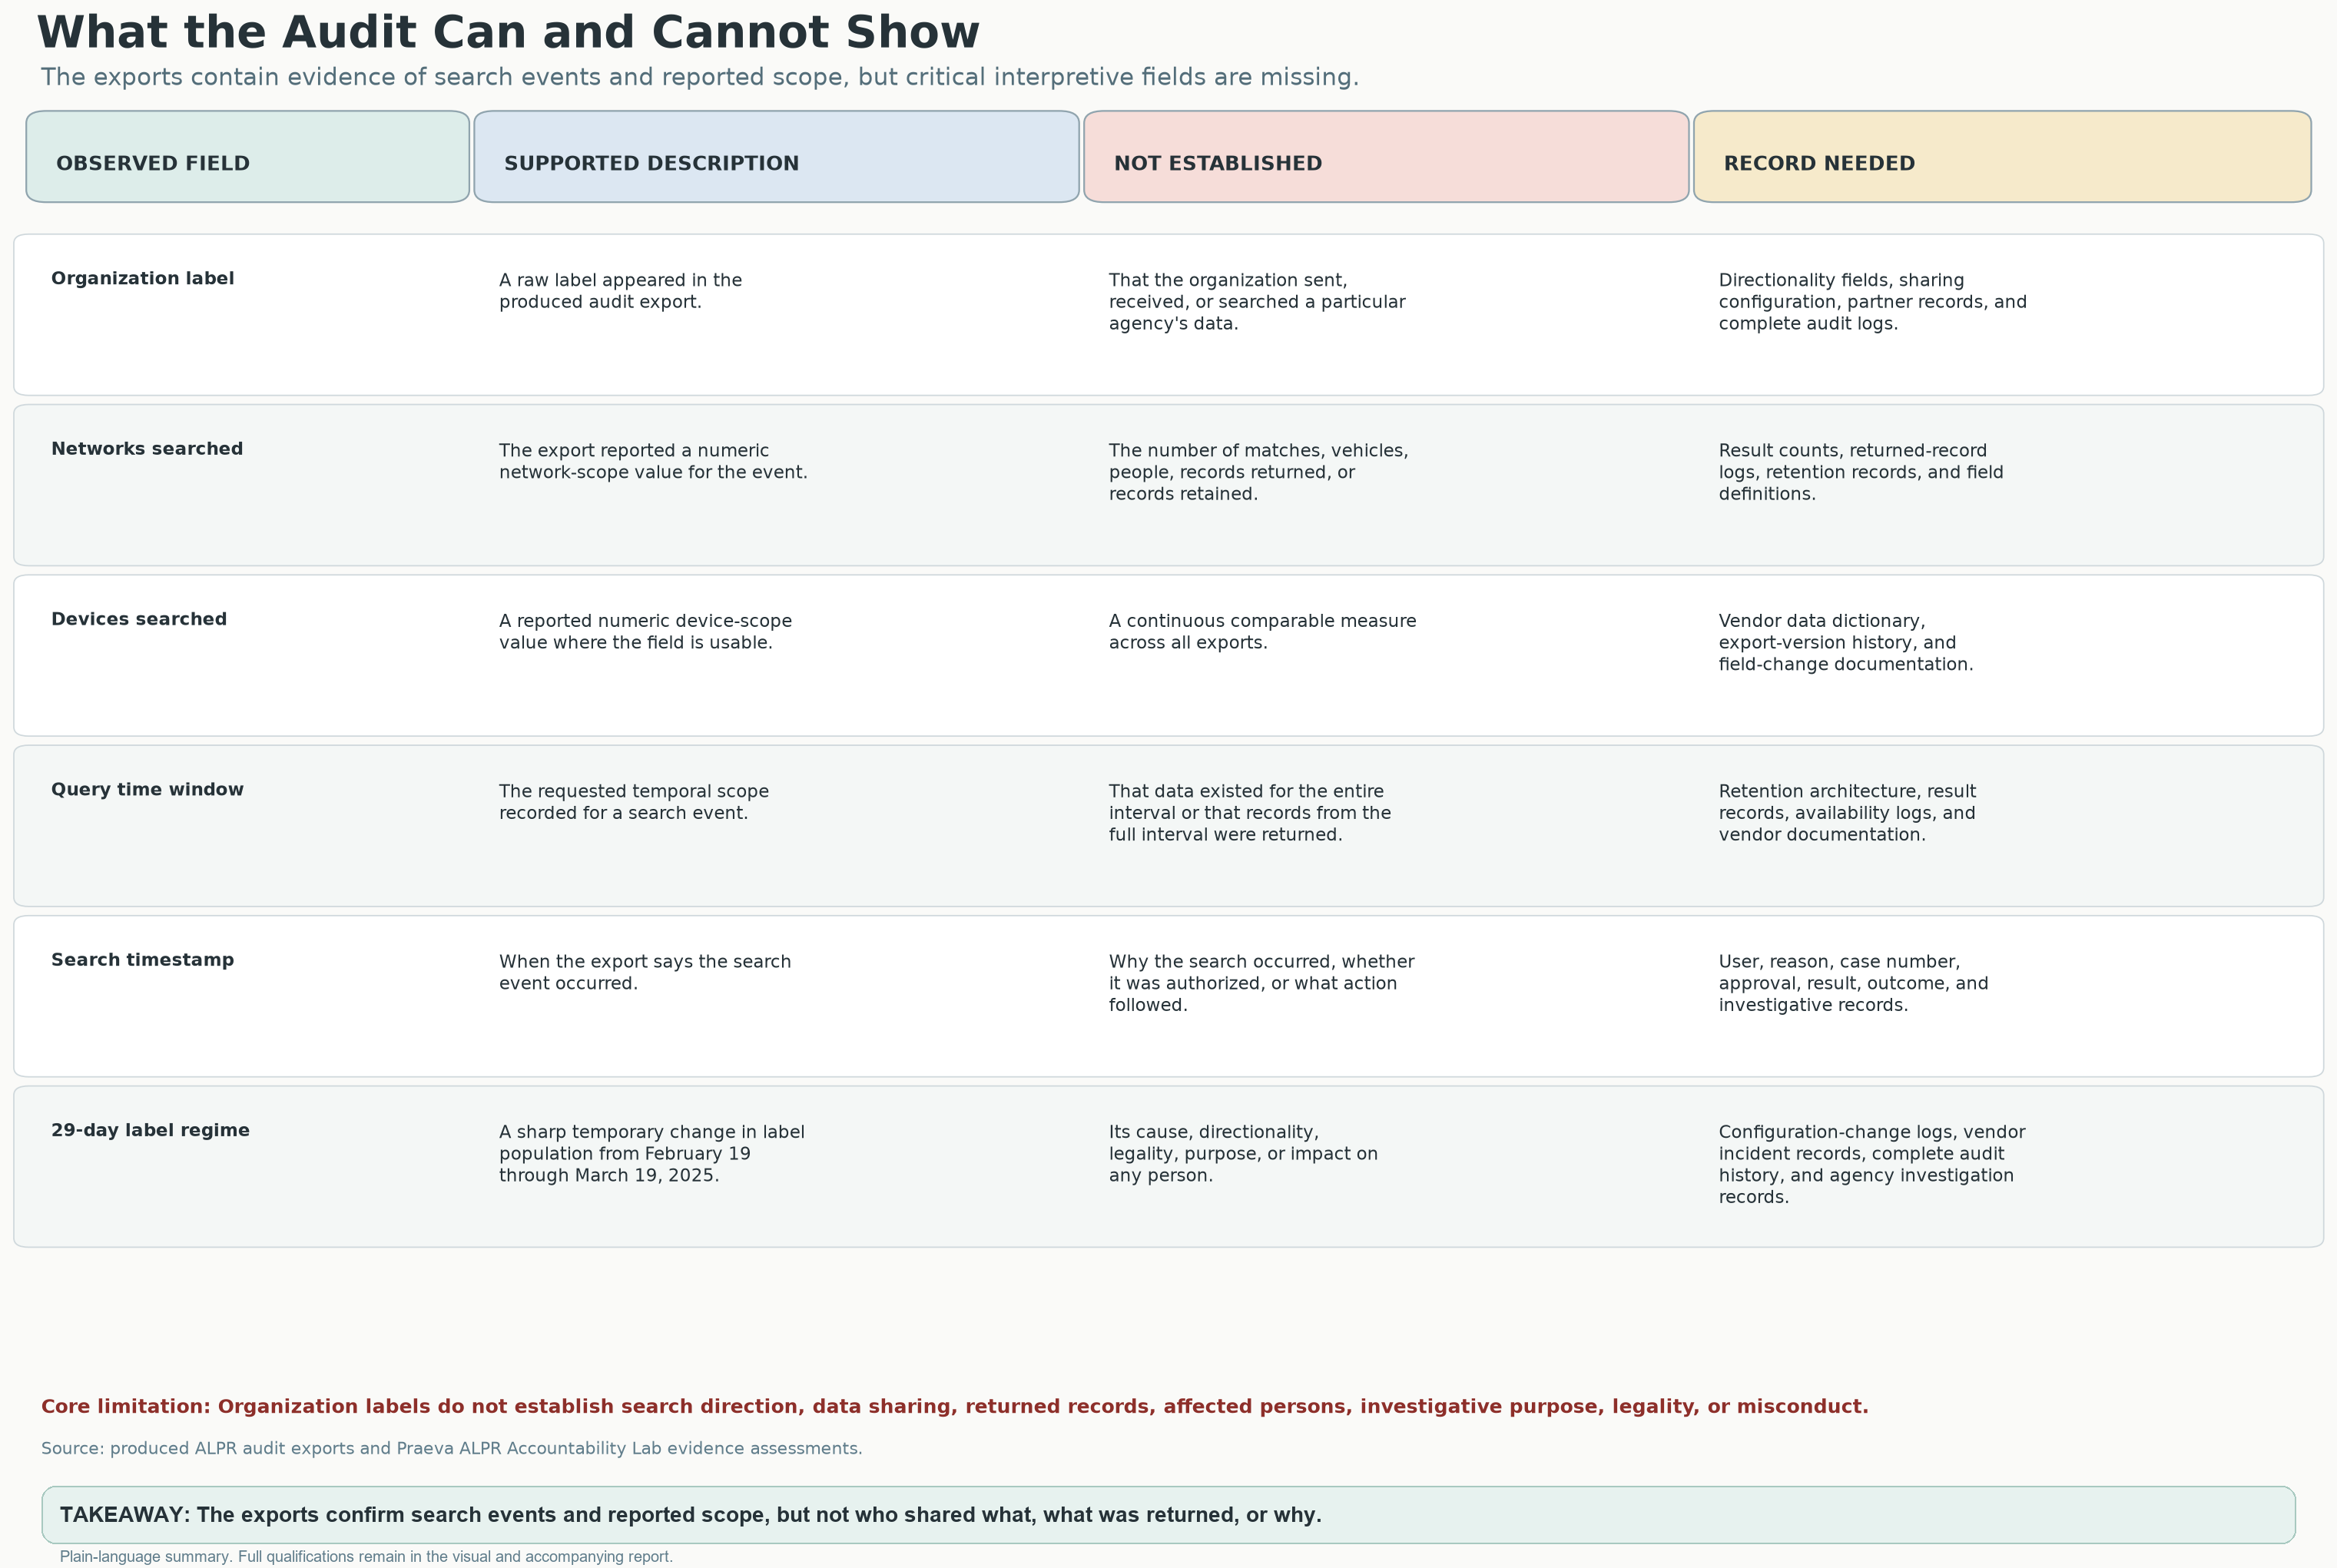
The original matrix organizes documented observations, interpretations and the records needed to answer questions about access, sharing, purpose and results.
Source: Praeva Analytics evidence-boundary matrix accompanying the report; original exports are not available here.
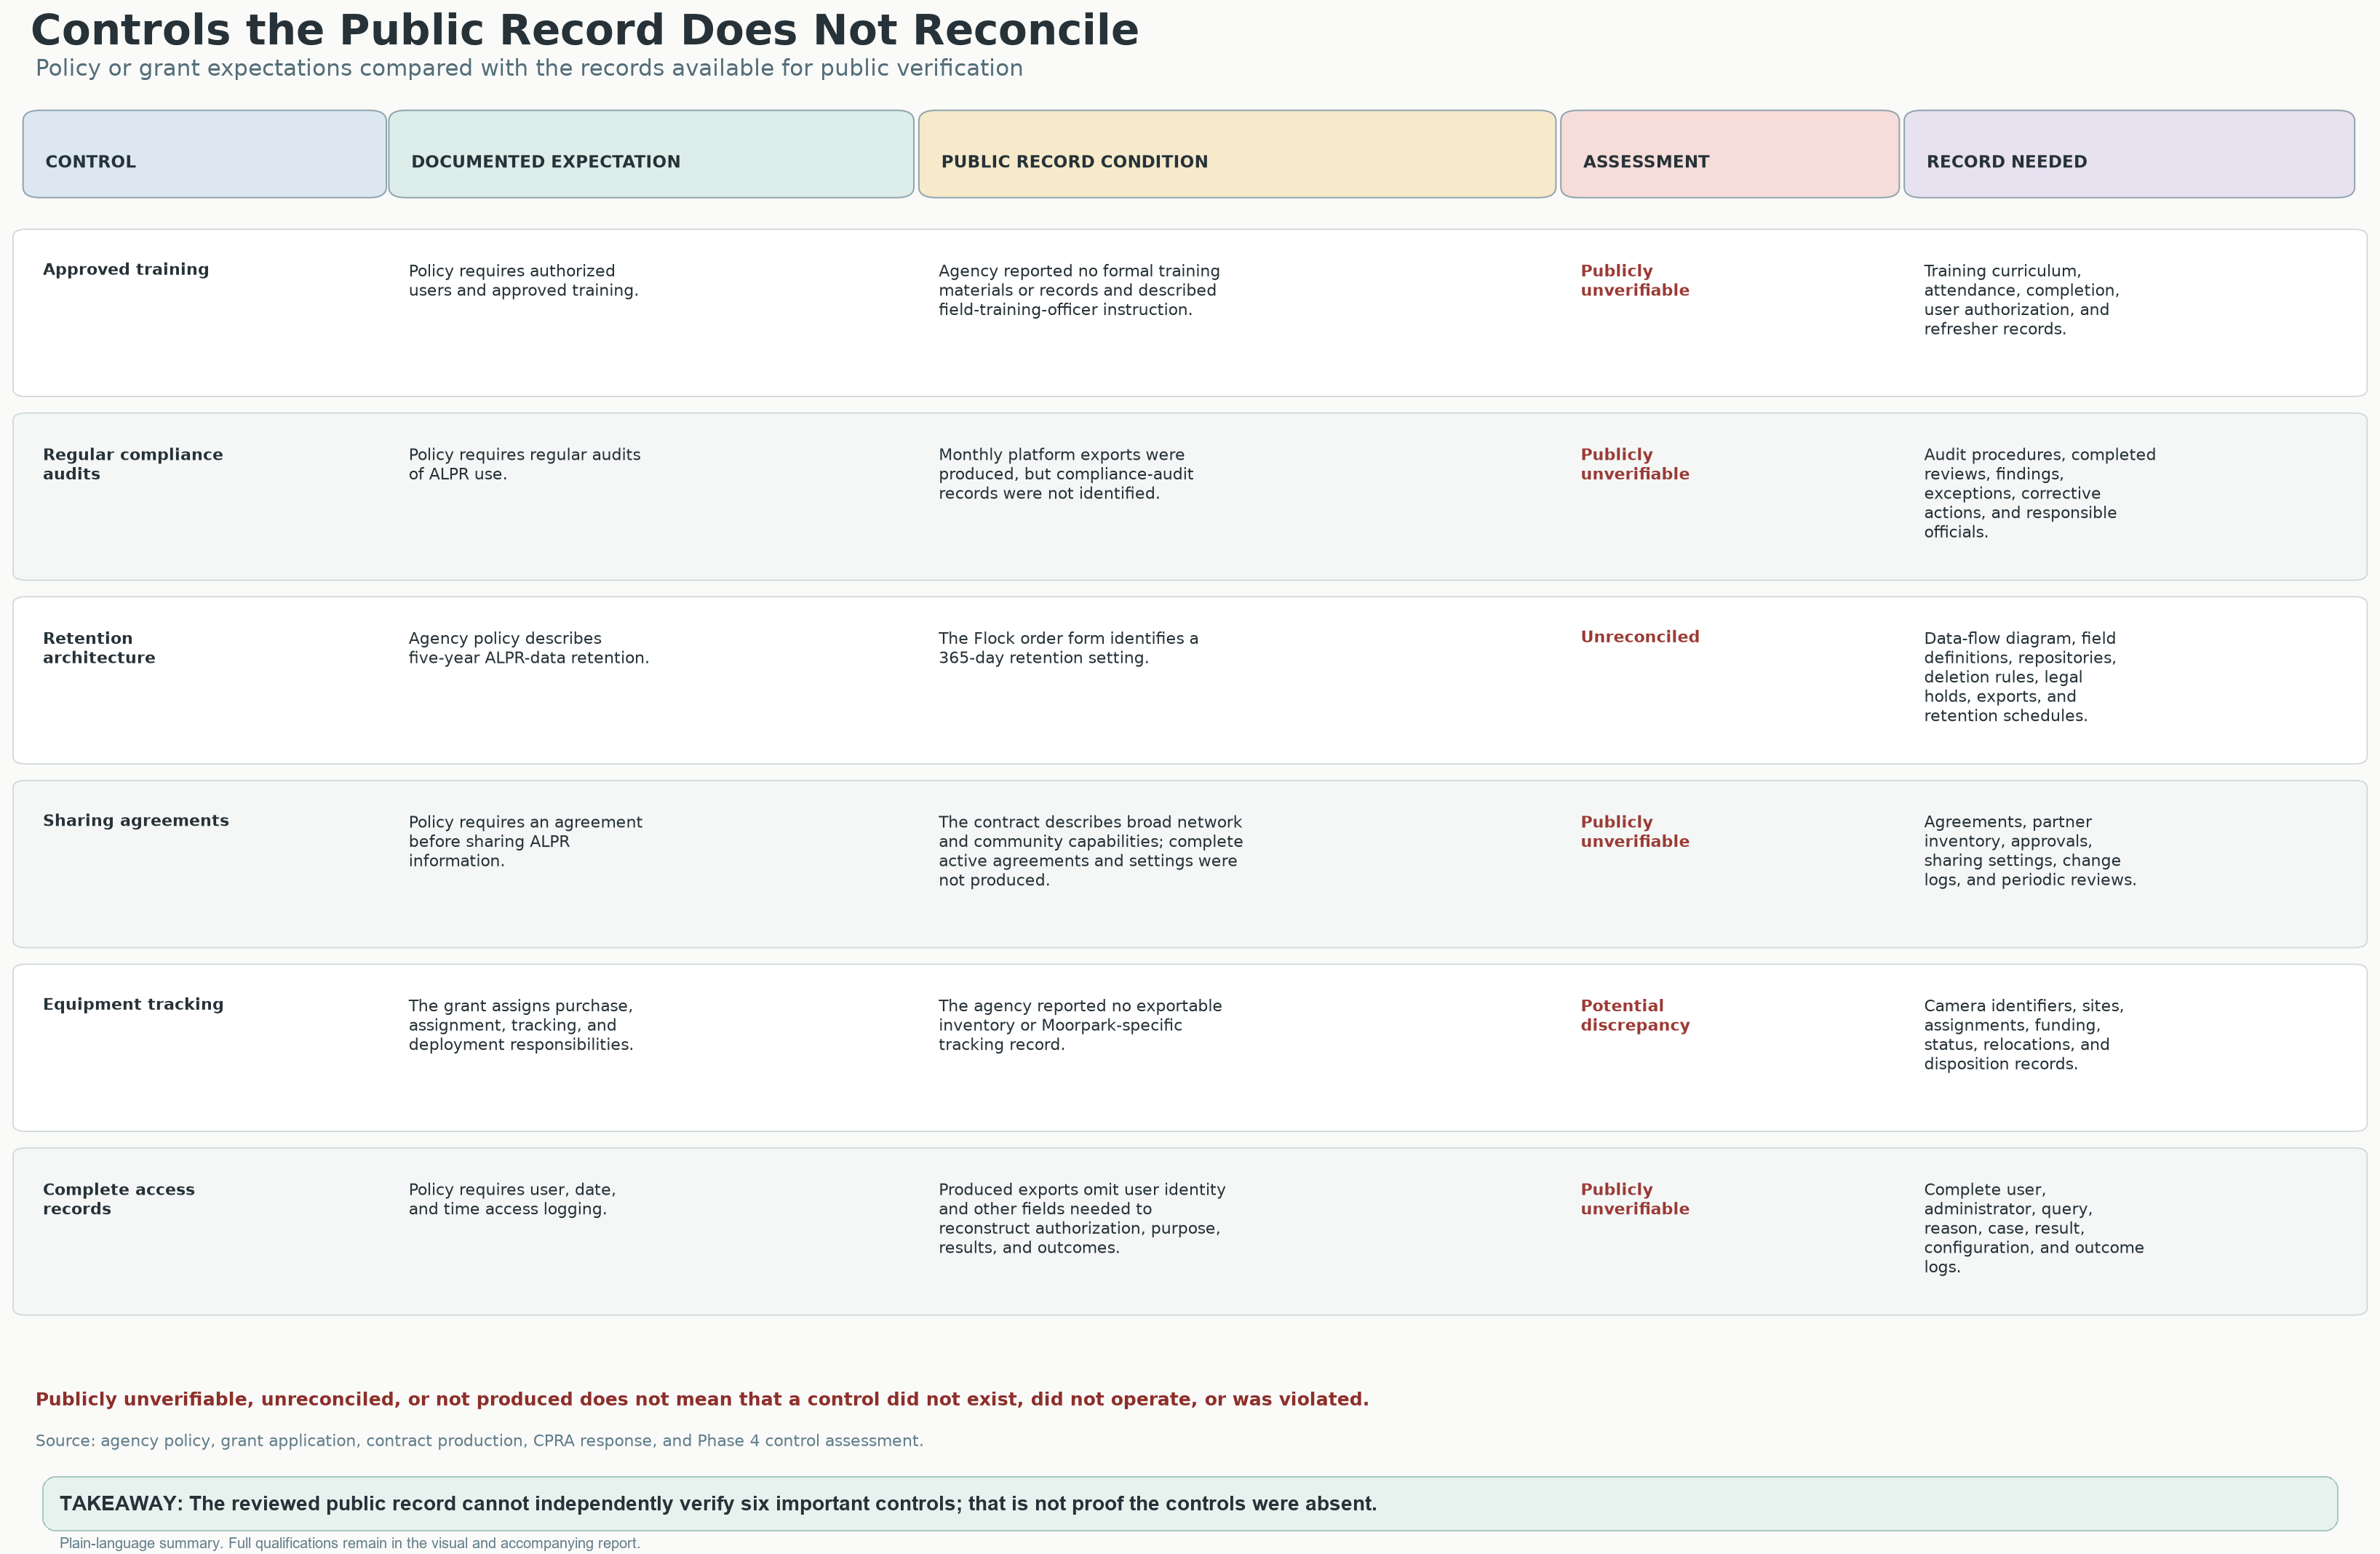
The original comparison covers training, compliance audits, retention, sharing agreements, equipment tracking and complete access records. The accompanying policy and contract references require repository-specific reconciliation.
Source: Original Praeva Analytics public-control reconciliation graphic; project analysis of policy, grant, contract and public-records materials.
ANALYSISExplained in the report; original agency-by-agency data not included
In several groups, VCSO ranks high for how often it appears and how far back its searches looked. The comparison is more mixed for how many networks and cameras its searches typically could reach.
| Comparison group | Number of agencies | Why compare them? |
|---|---|---|
| California sheriffs | n = 40 | Agencies with a similar role |
| Activity band (0.5×–2× VCSO) | n = 4 | Similar activity totals, not necessarily similar duties |
| Population band (±25%) | n = 4 | Agencies serving similarly sized populations |
| Nationwide sheriffs | n = 848 | A broader comparison |
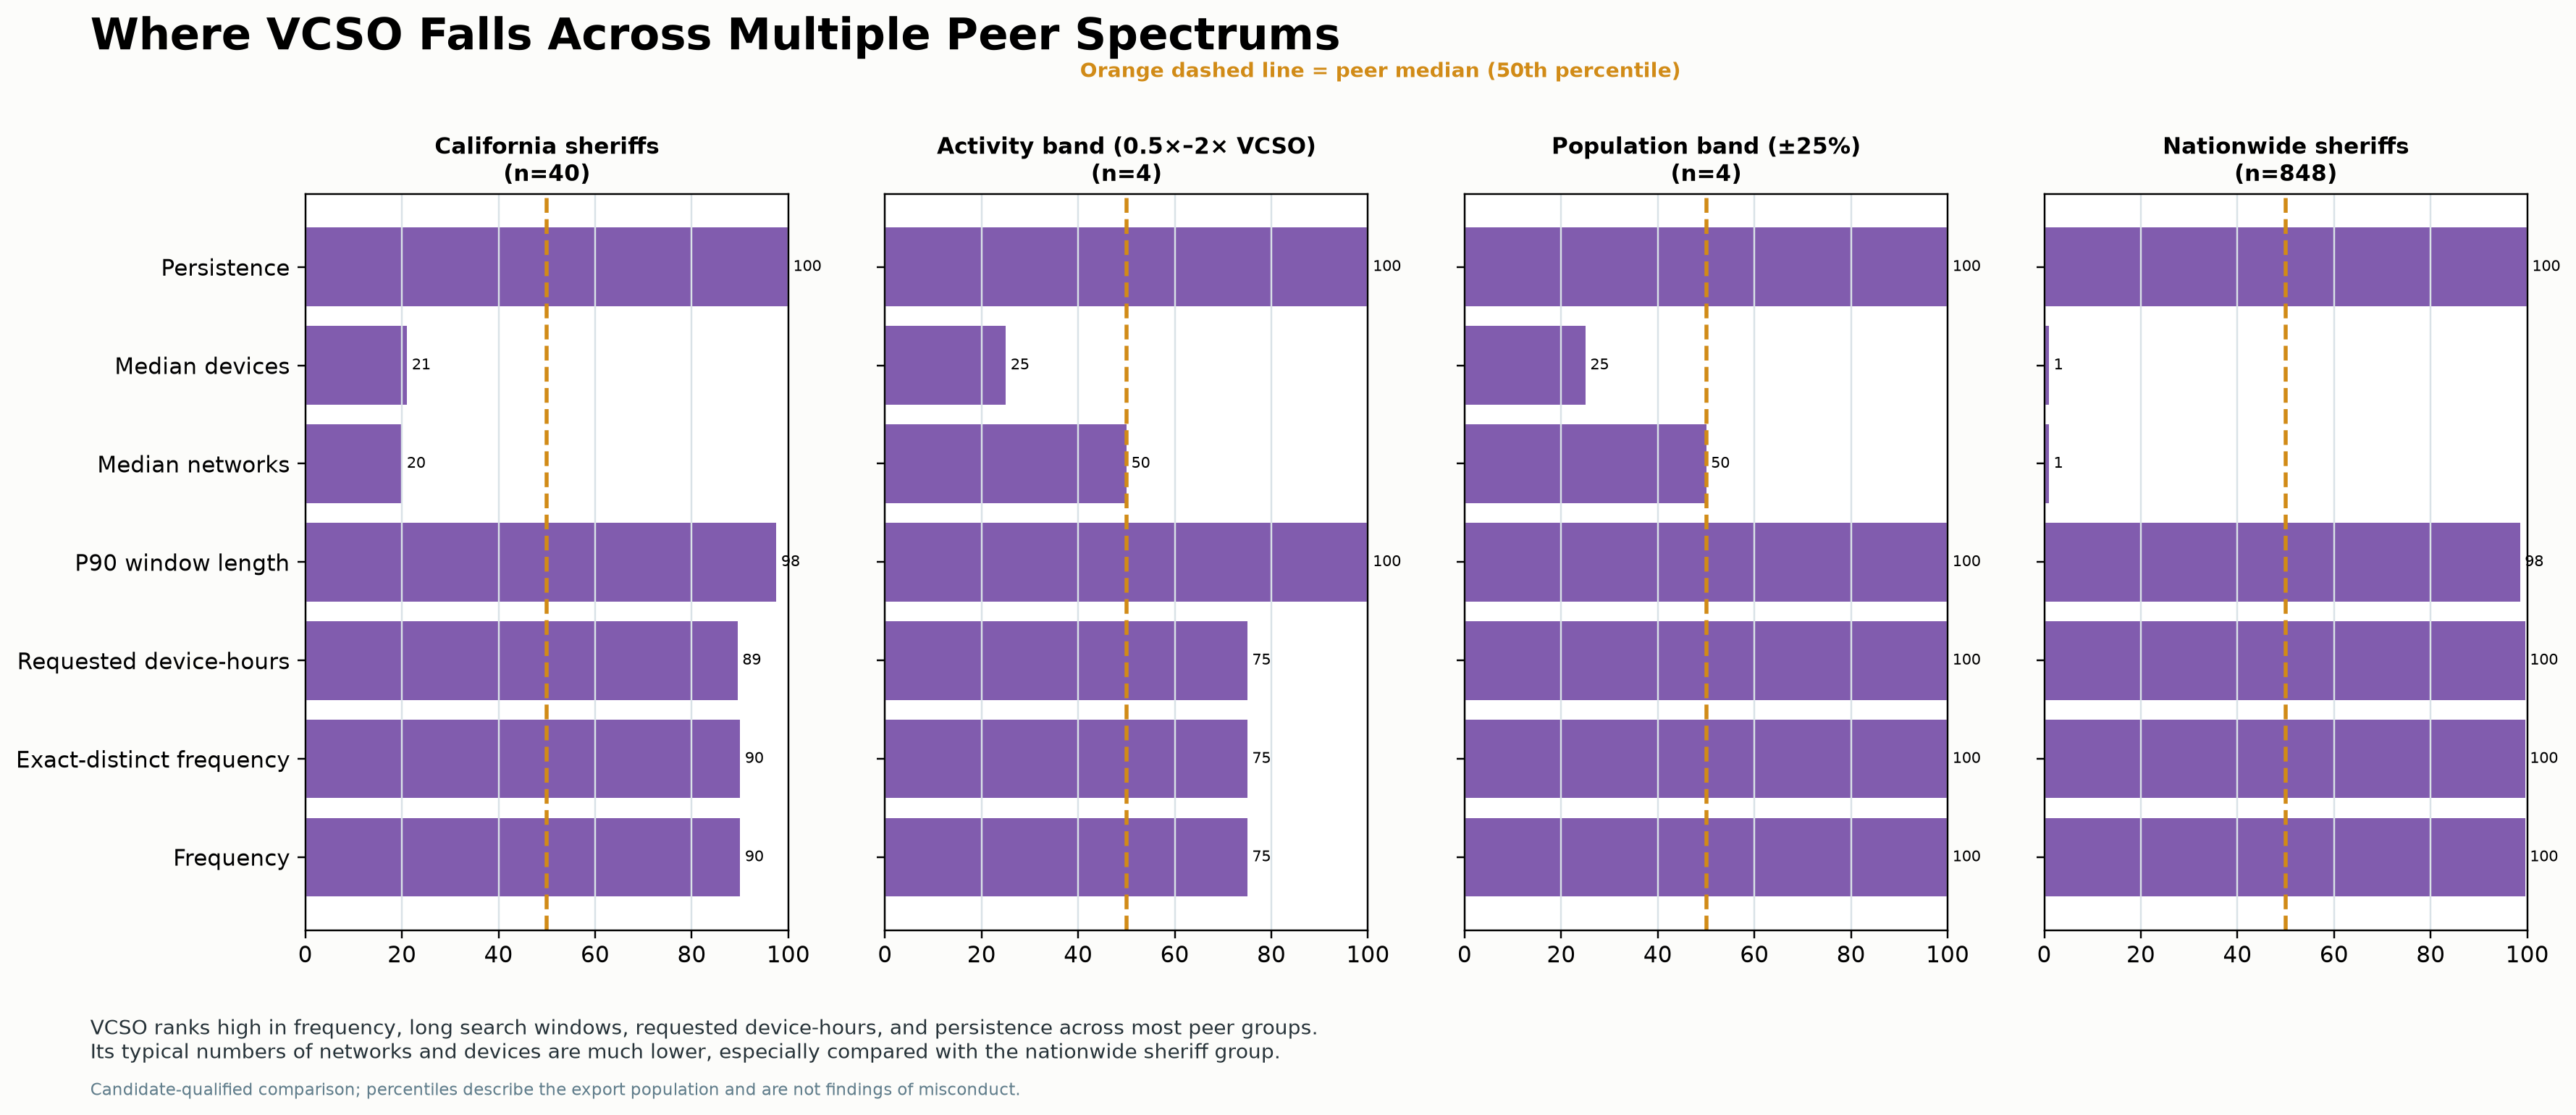
The four panels compare California sheriffs, an activity band, a population band and nationwide sheriffs. Cohorts vary greatly in size, so percentile rankings are not interchangeable. These candidate-qualified comparisons describe the export population.
Source: Praeva Analytics peer-percentile graphic; Civic Review Packet pp. 10–11 and methods p. 31. Comparison-group definitions and sizes appear in the image; raw membership and metric tables are not available here.
These rankings describe the comparison, account for ties and are not grades. Small groups can change greatly when different agencies are included. The full agency lists and how they were grouped still need to be checked.
Source: Civic Review Packet, pp. 10–11 and methods p. 31. Report explanation, not raw comparison-group data.
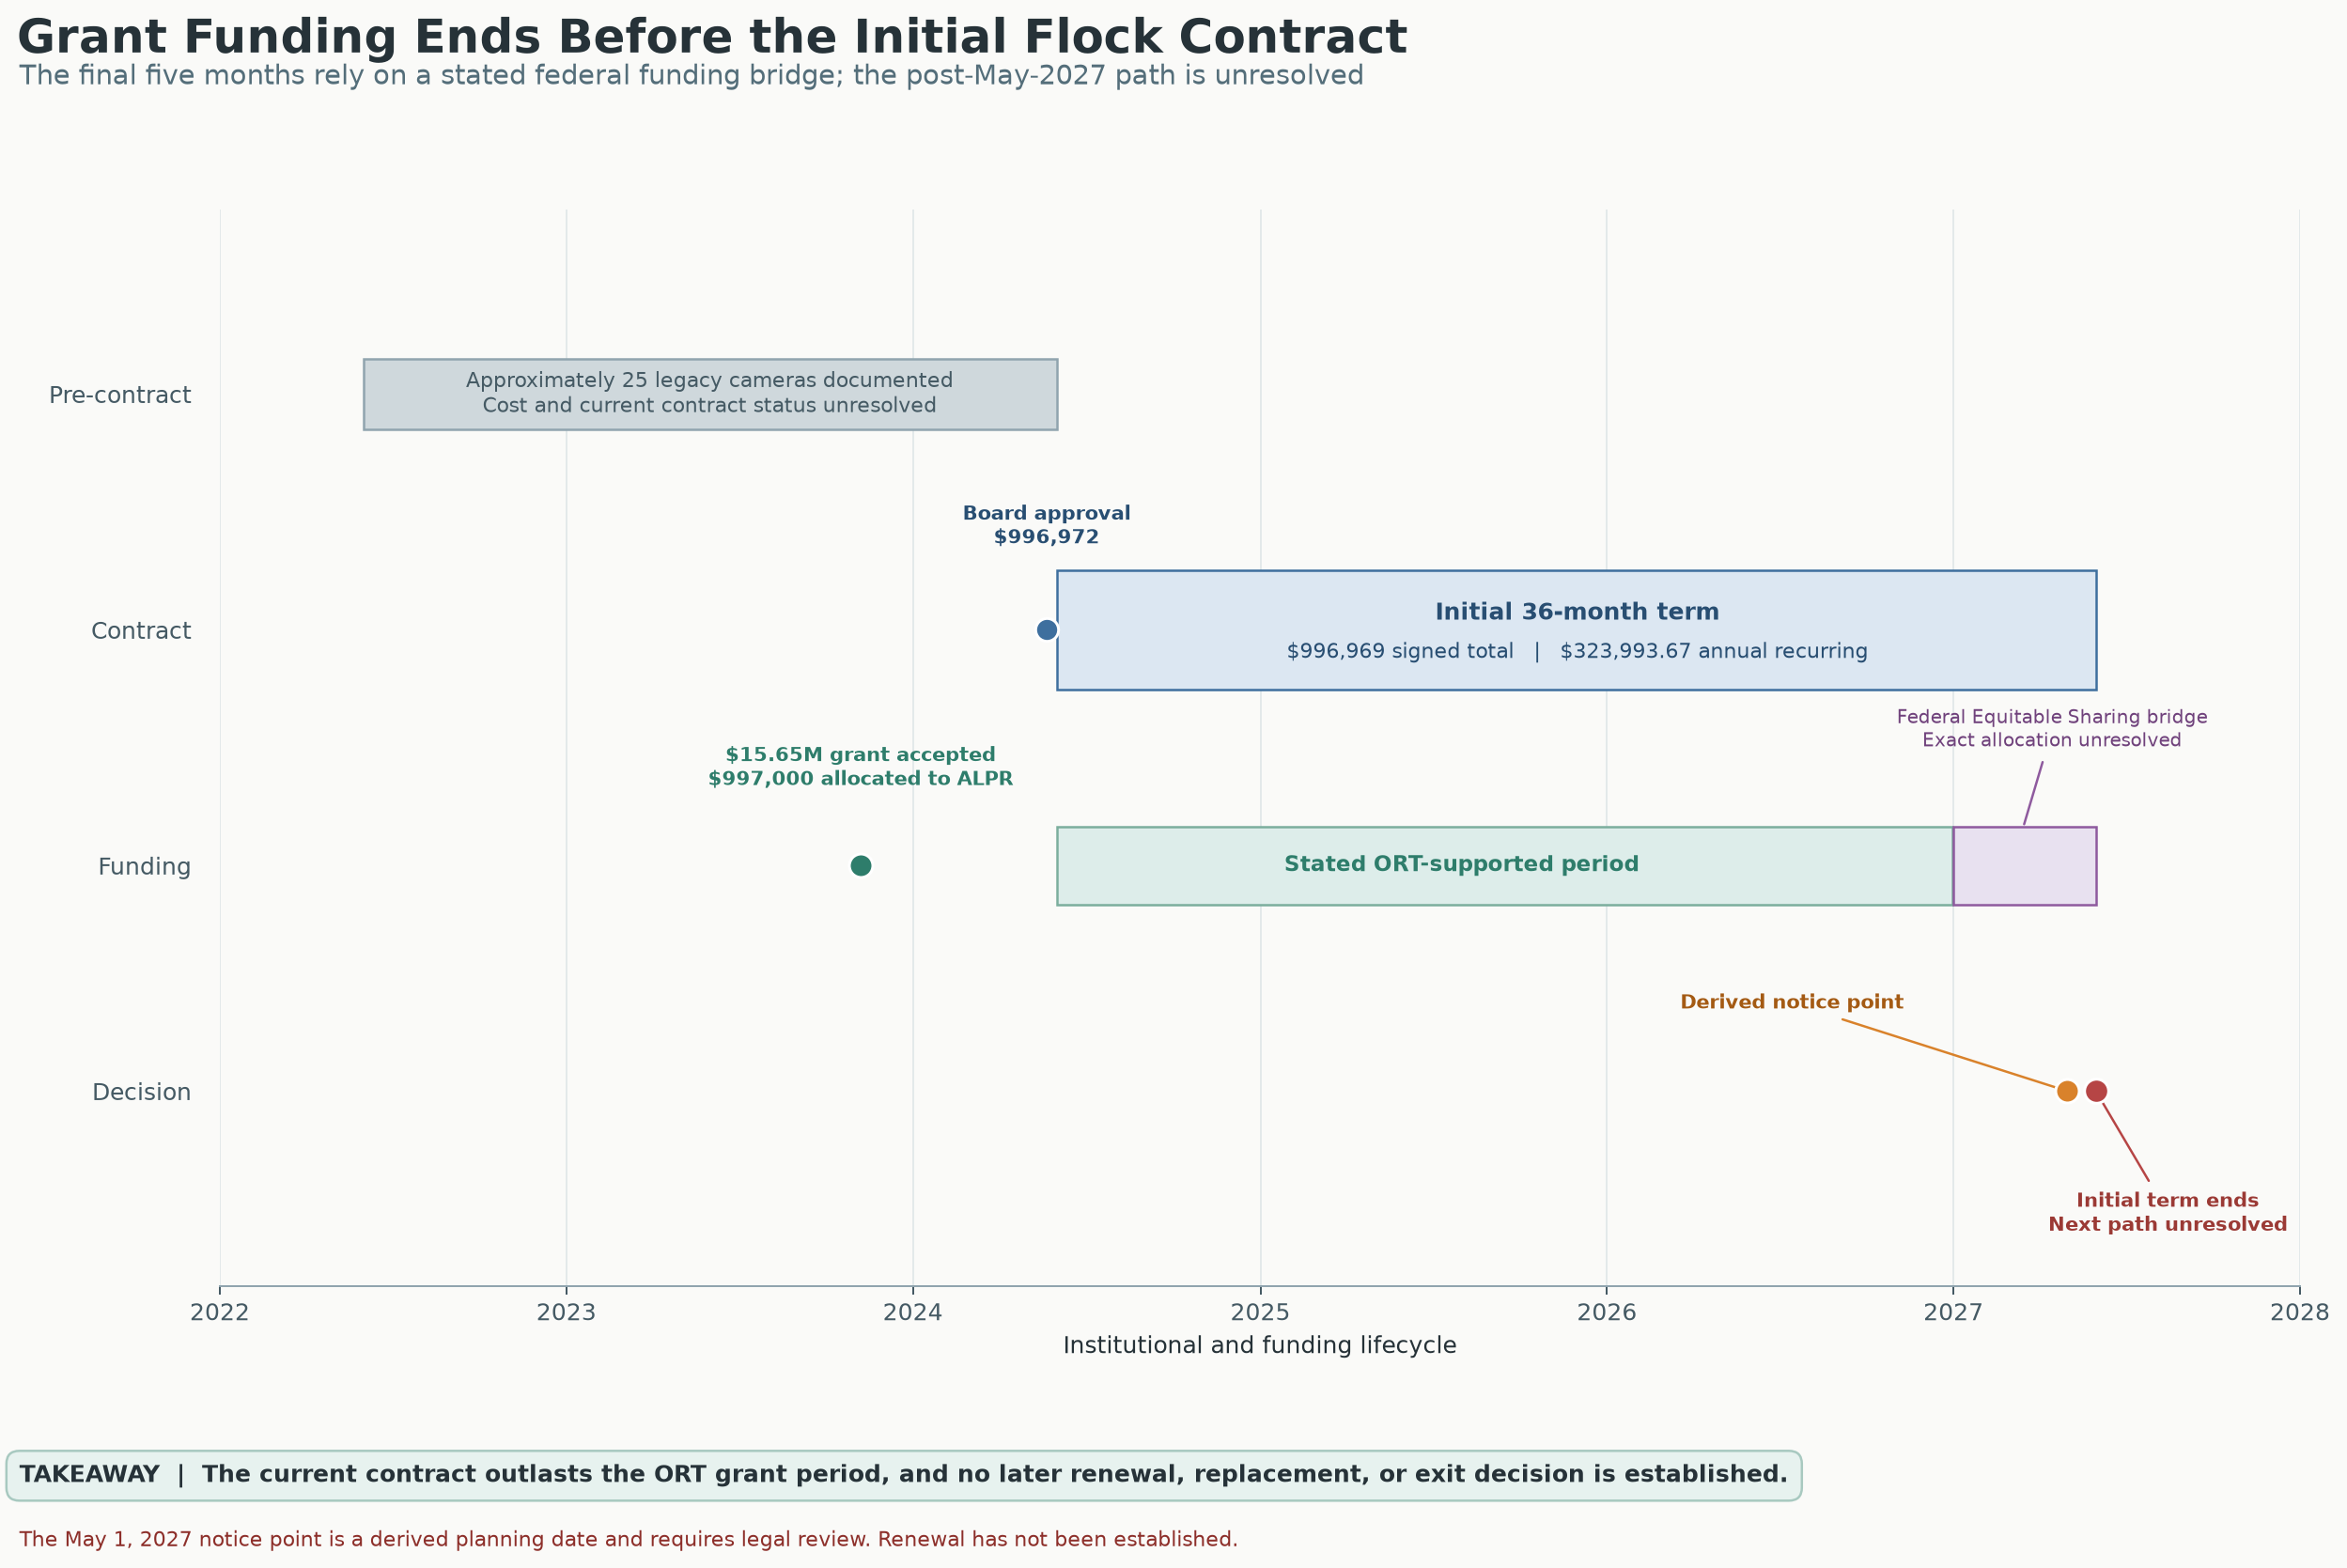
Read this project-provided timeline alongside the report and legal receipts; it is not a substitute for the original procurement, grant or contract records.
Source: Praeva Analytics funding timeline accompanying the analytical report.
Each link opens its original image, without cropping or recompression.
These seven editorial graphics accompany the investigation. The notes distinguish measured findings from illustrated claims that remain unverified.
DOCUMENTED Official Ventura County Sheriff’s Office report, dated April 22, 2026, covering January 1–December 31, 2025. Its reported inventories and usage are agency-reported figures, not independent operational verification.
UNRESOLVED 70 “Homeless related operations”: What did those drone operations involve? Who approved them? How long was data kept, and which systems could receive it? These events cover the overall program, not Wingtra alone.
UNRESOLVED 81 Organized Retail Theft operations. What UAV workflows and safeguards were used? The report does not document any relationship between these UAV events and Flock or Axon.
UNRESOLVED Approximately $15,229 for “network video upgrades, enhanced recorders and associated equipment.” This appears under ROOK/tracked-armored-vehicle equipment costs, from the existing FY 25/26 budget (printed page 5; PDF page 6). Ask what equipment and governing rules it covered. The report does not establish a relationship to ALPR, Axon or Fusus. It is a follow-up lead only.
The Chapter 8 comparison is a governance recommendation, not a claim that ALPR is covered by AB 481 or that a statutory reporting violation occurred.
The graphics illustrate possible connections, not a verified local system map. Vendor capability is not confirmed VCSO deployment. The cell-site-simulator purchase and integration remain unverified.
This is a conceptual illustration, not a verified feature inventory for a particular ALPR device or a map of VCSO’s deployed system. People or objects visible in an image are not necessarily identified, indexed or separately searchable. VCSO-specific records are needed to establish video capture, enabled tools and actual search results.
Source: editorial infographic. Compare with the analytical report, report receipts and source status; the artwork is not an agency record or a new calculation.
The lines show possible ways to get access, not completed searches, returned information or verified local connections between vendor platforms. Dated agreements and settings records are needed to check federal, out-of-state and international access. The California-agency label represents an attributed assurance, not a verified inventory of all current or historical sharing.
Source: editorial infographic. Compare with the analytical report, report receipts and source status; the artwork is not an agency record or a new calculation.
Flock Organization and Network Audit Logs and an Axon audit trail were received. “Not provided” means missing accountability detail, not no activity files or proof that a record does not exist. Original presentation and response records are needed to verify the quoted wording and categories.
Source: editorial infographic. Compare with the analytical report, report receipts and source status; the artwork is not an agency record or a new calculation.
These are possible users and connections, not a checked list of who has access now. The 58-agency statement is what VCSO said at a particular time, not the full history of settings or use.
Source: editorial infographic. Compare with the analytical report, report receipts and source status; the artwork is not an agency record or a new calculation.
The measured series counts entries and organization names. The artwork’s reach and network lines are illustrative, not calculations from the daily/monthly datasets. March 2026 is partial.
Source: editorial infographic. Compare with the analytical report, report receipts and source status; the artwork is not an agency record or a new calculation.
The report compares NCRIC across January–July 2024 and August 2024–February 2026. The artwork uses October 2024–March 2026; its ratios (~70% fewer searches, ~3× scope, ~4× networks), camera counts and international access remain unverified. What a search asked to cover is different from what it actually showed.
Source: editorial infographic. Compare with the analytical report, report receipts and source status; the artwork is not an agency record or a new calculation.
This image brings the argument together. The findings remain tied to the records and measurements explained above; the illustrations of access and growth are not additional findings.
Source: editorial infographic. Compare with the analytical report, report receipts and source status; the artwork is not an agency record or a new calculation.
The labels tell you what supports each statement: DOCUMENTED = backed by a record provided or an official source, with the source limits stated; VCSO SAYS = the agency’s account; PLATFORM CAPABILITY = a vendor-described function, not confirmed VCSO deployment; ANALYSIS = a conclusion drawn from the available evidence; UNRESOLVED = the available records leave the question unanswered.